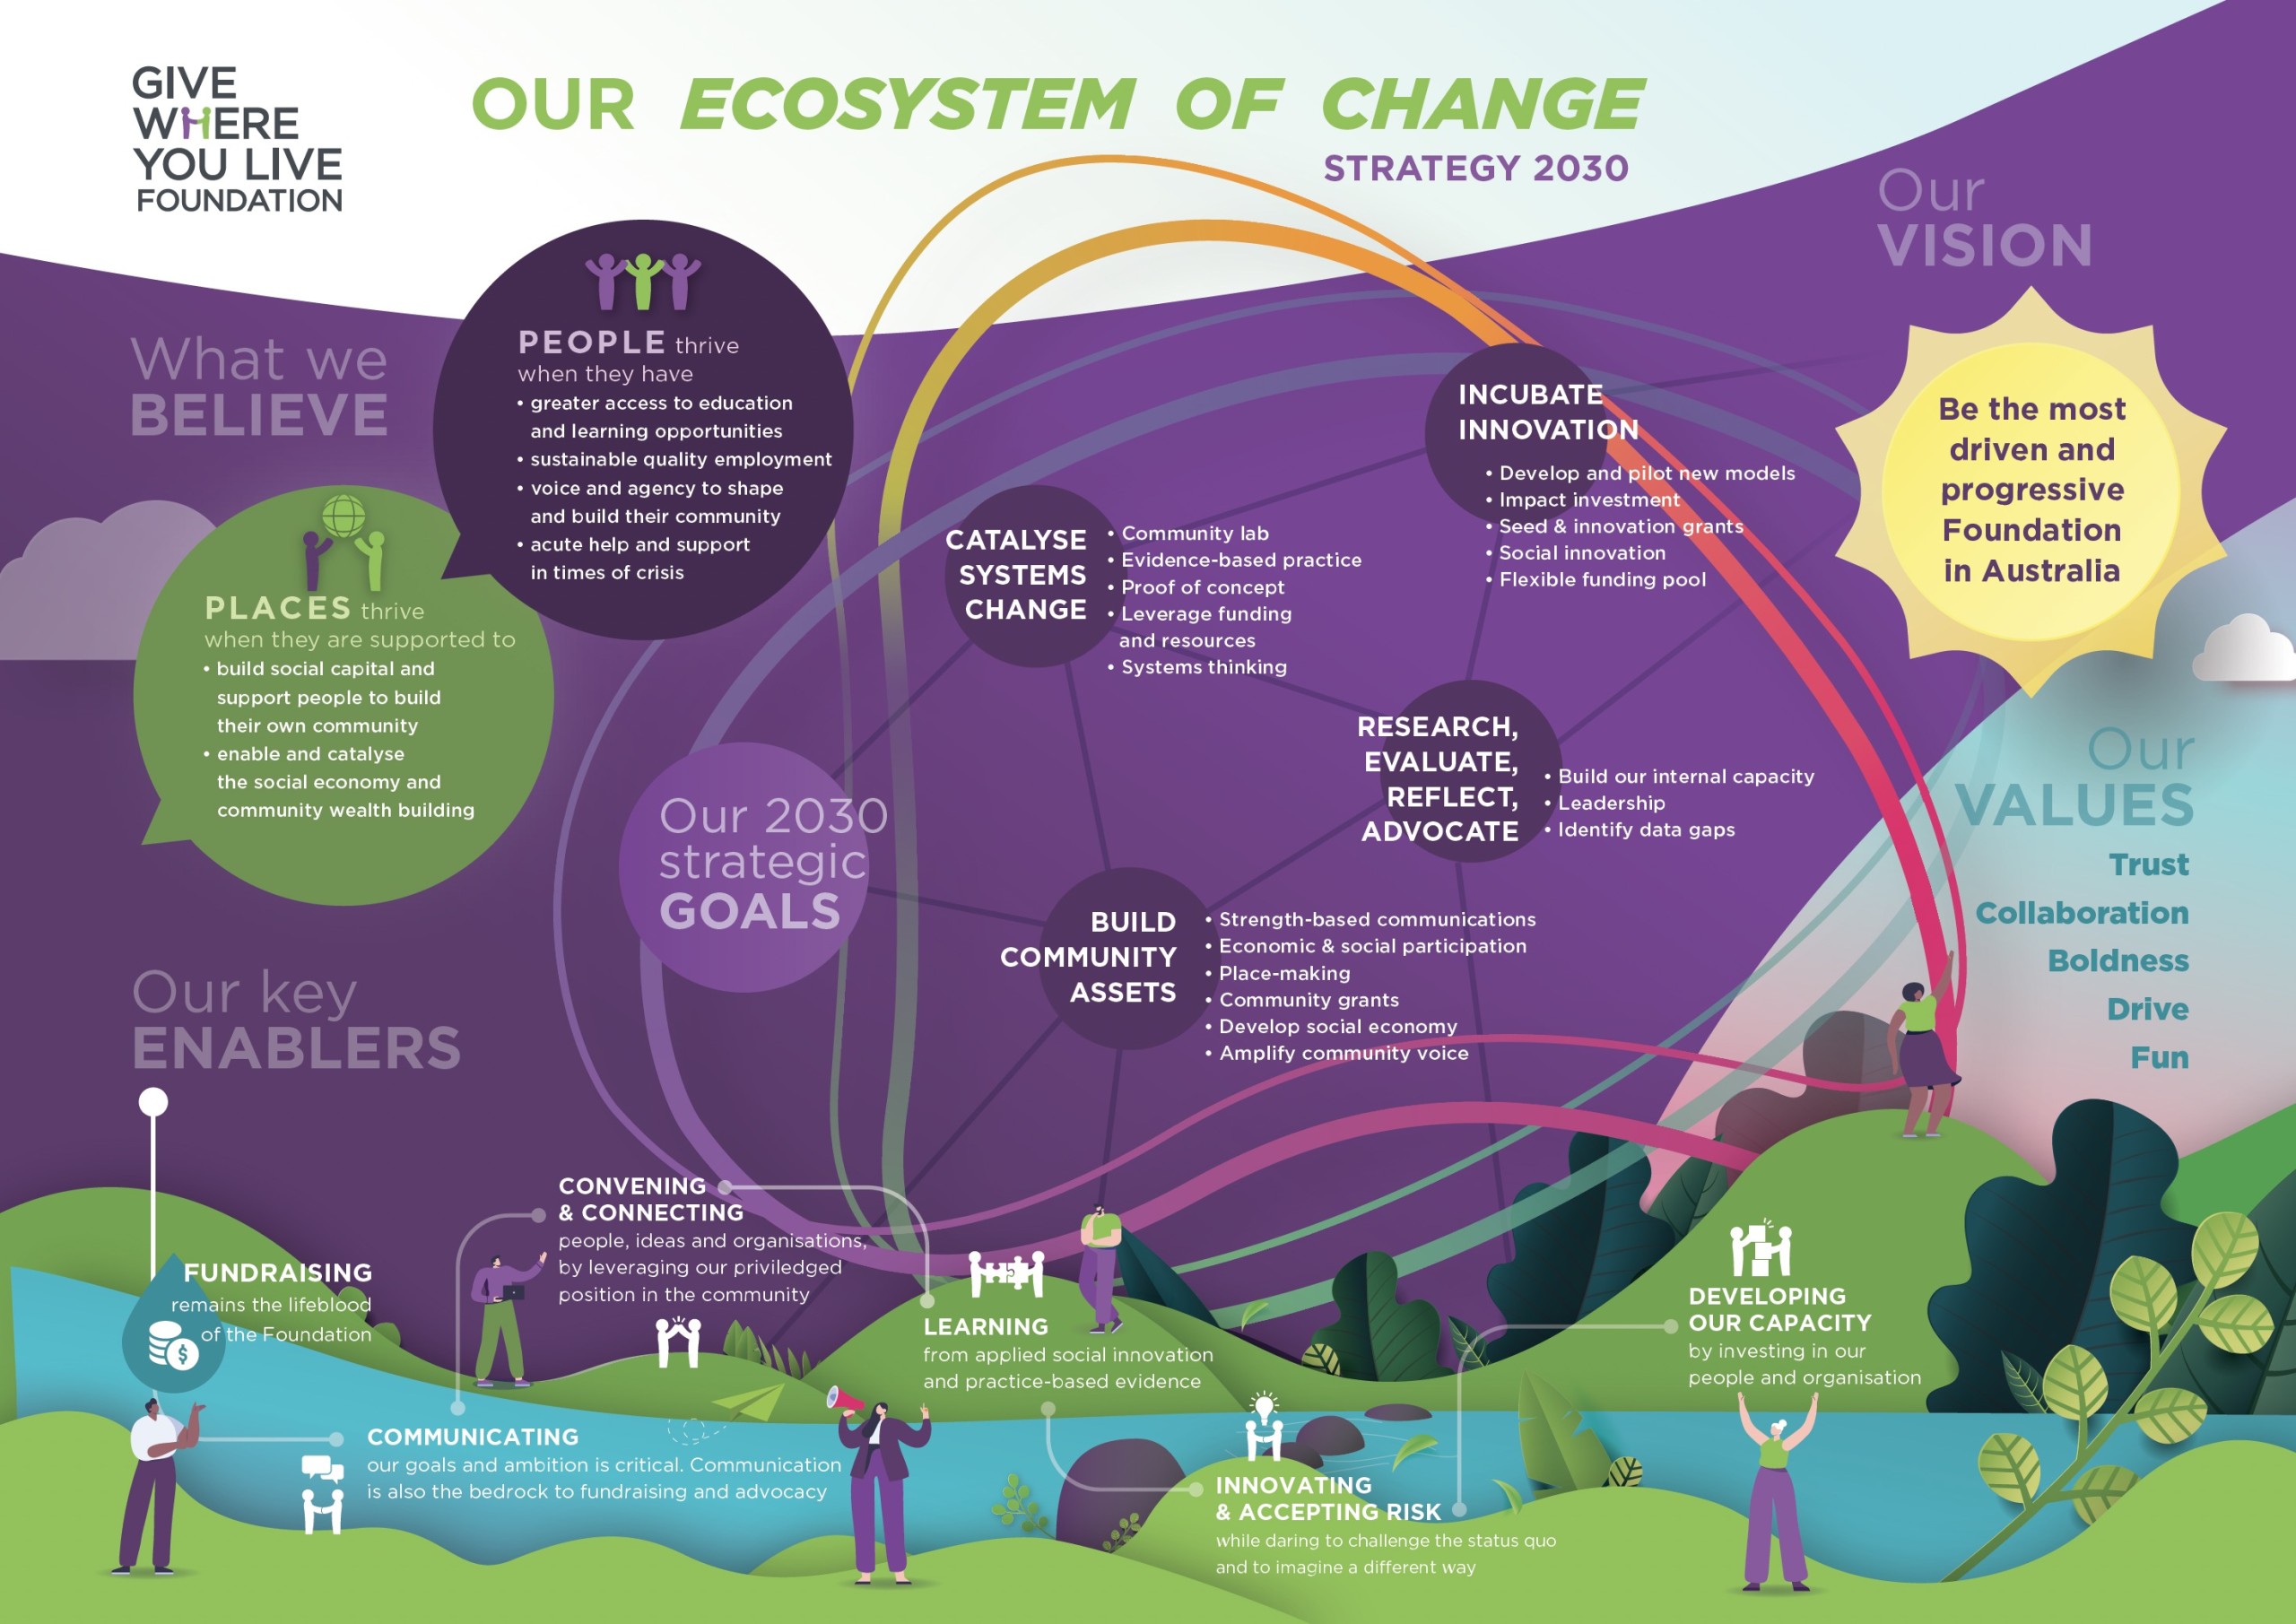
Infographic design
When information is complex, clarity creates alignment and space to think.
Researchers and strategists are trained to write for their field. But funding panels, executives and decision-makers read for impact. That gap is where communication breaks down, and where the right visual can do what prose alone can’t.
I design infographics that translate research, data and strategy into coherent visuals that make key ideas visible , connected and accessible. The work starts with understanding the context and identifying what matters most. Visual elements follow with intention, flow and logic, so meaning unfolds intuitively.
The result is communication that holds together intellectually, not just aesthetically, so your audience can orient, think and engage with confidence.


Infographics & illustrations for
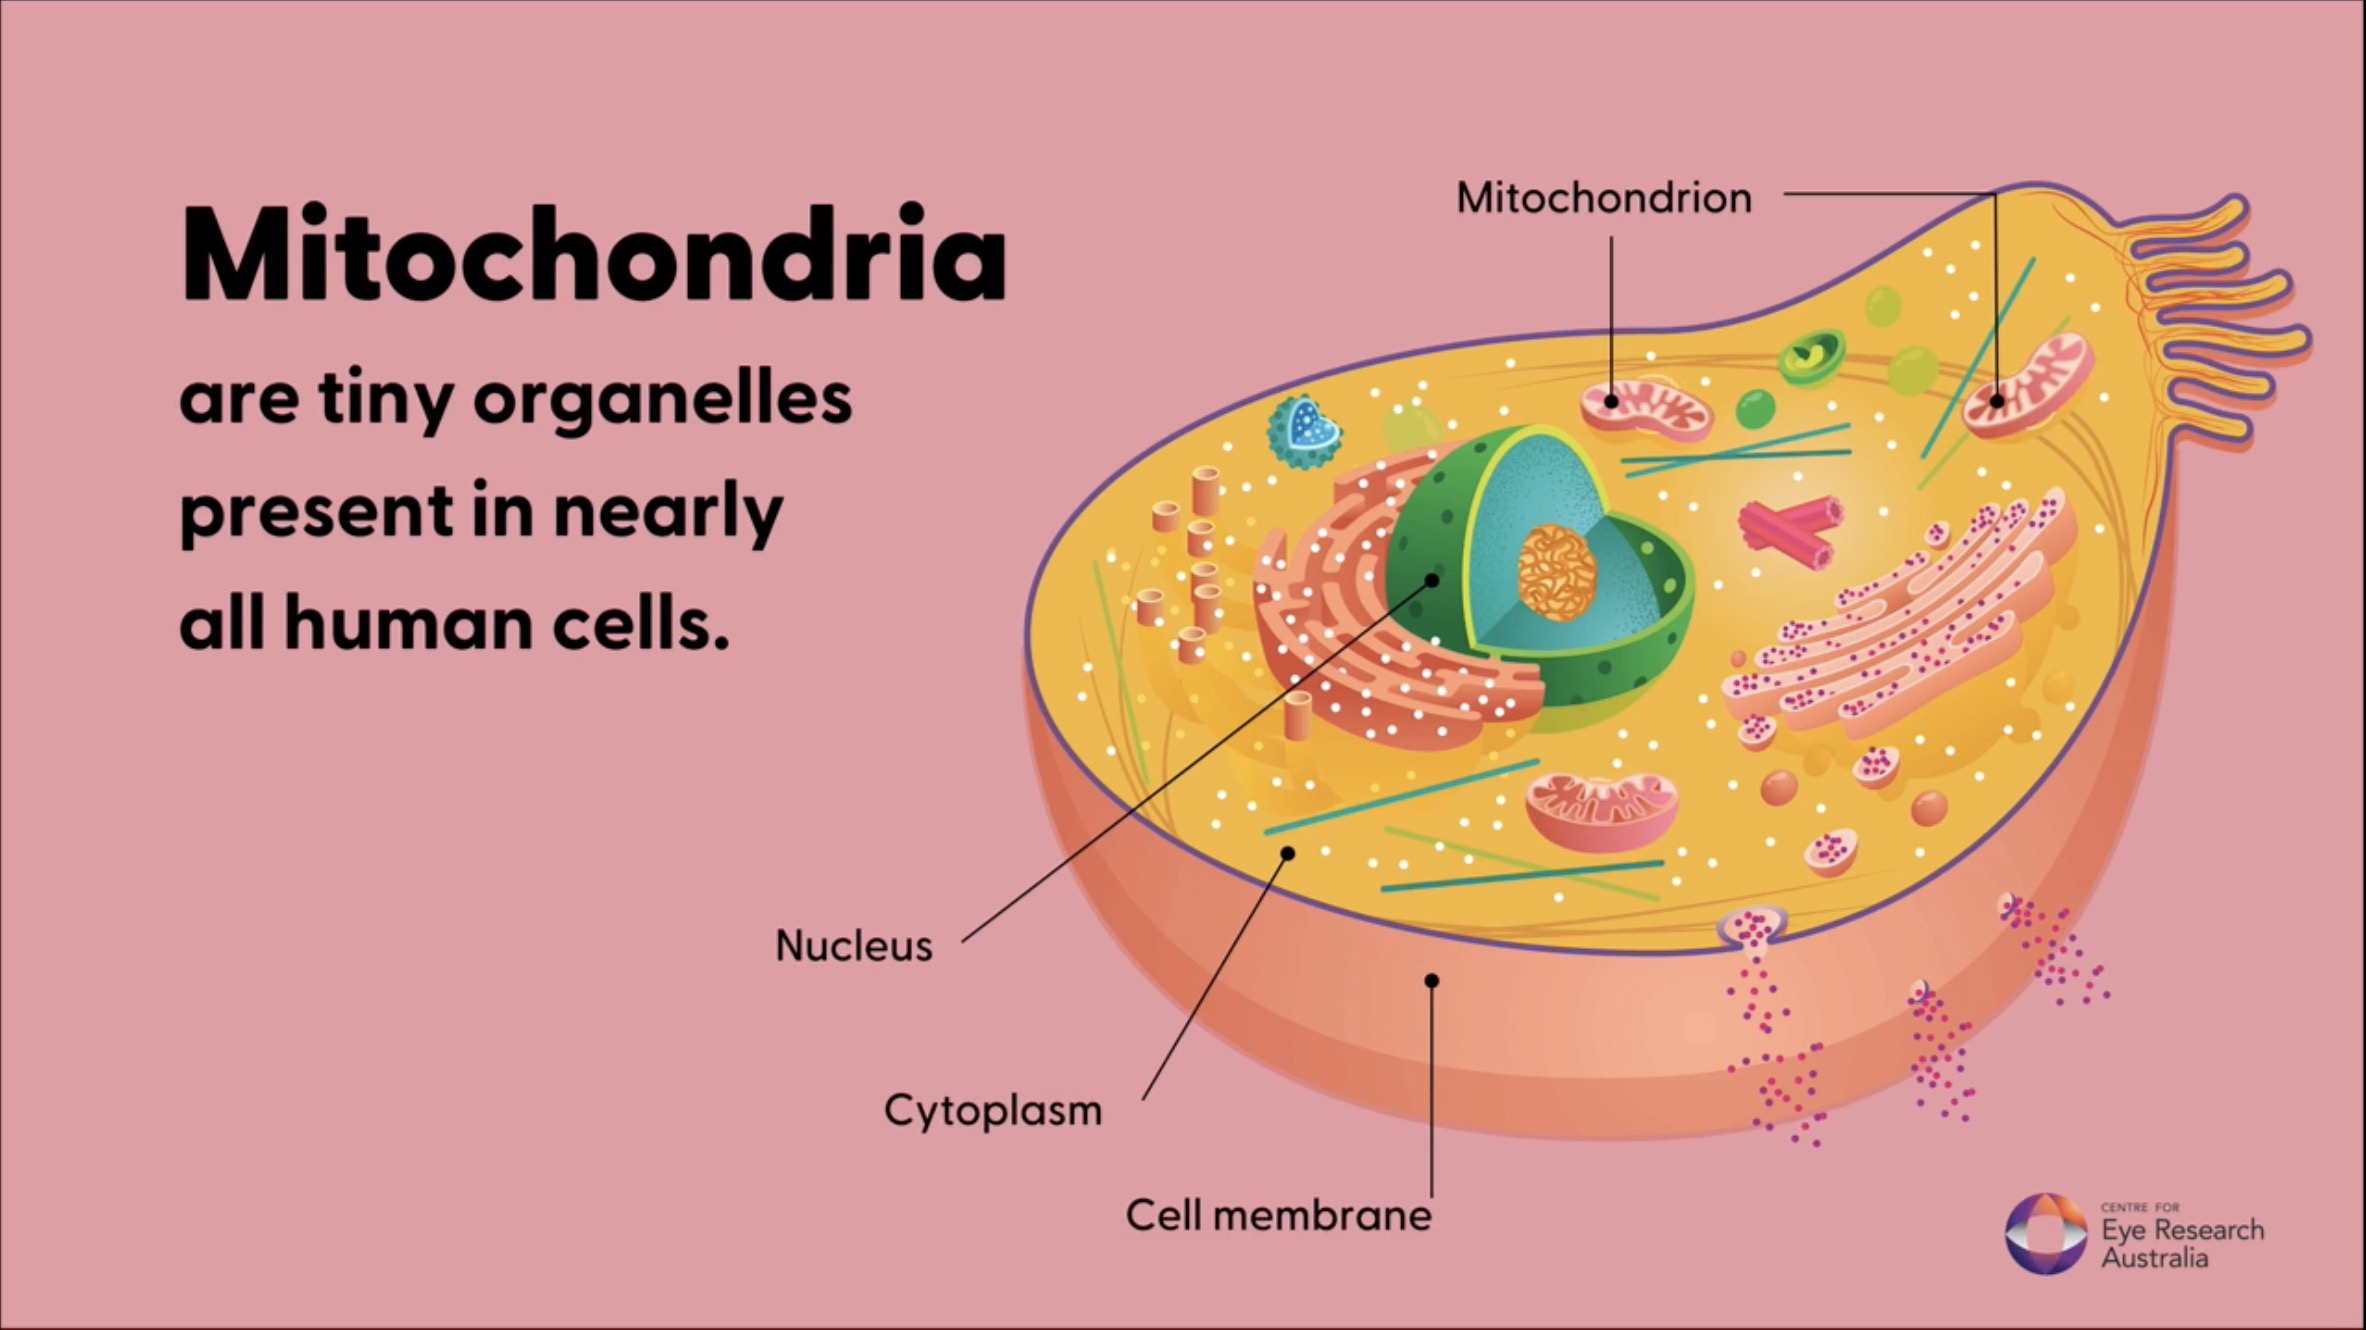
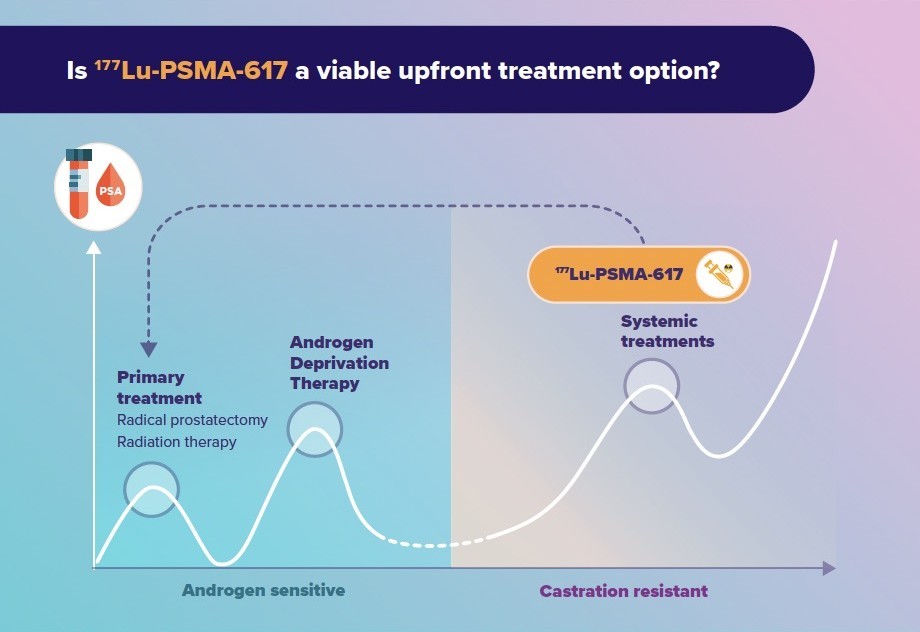
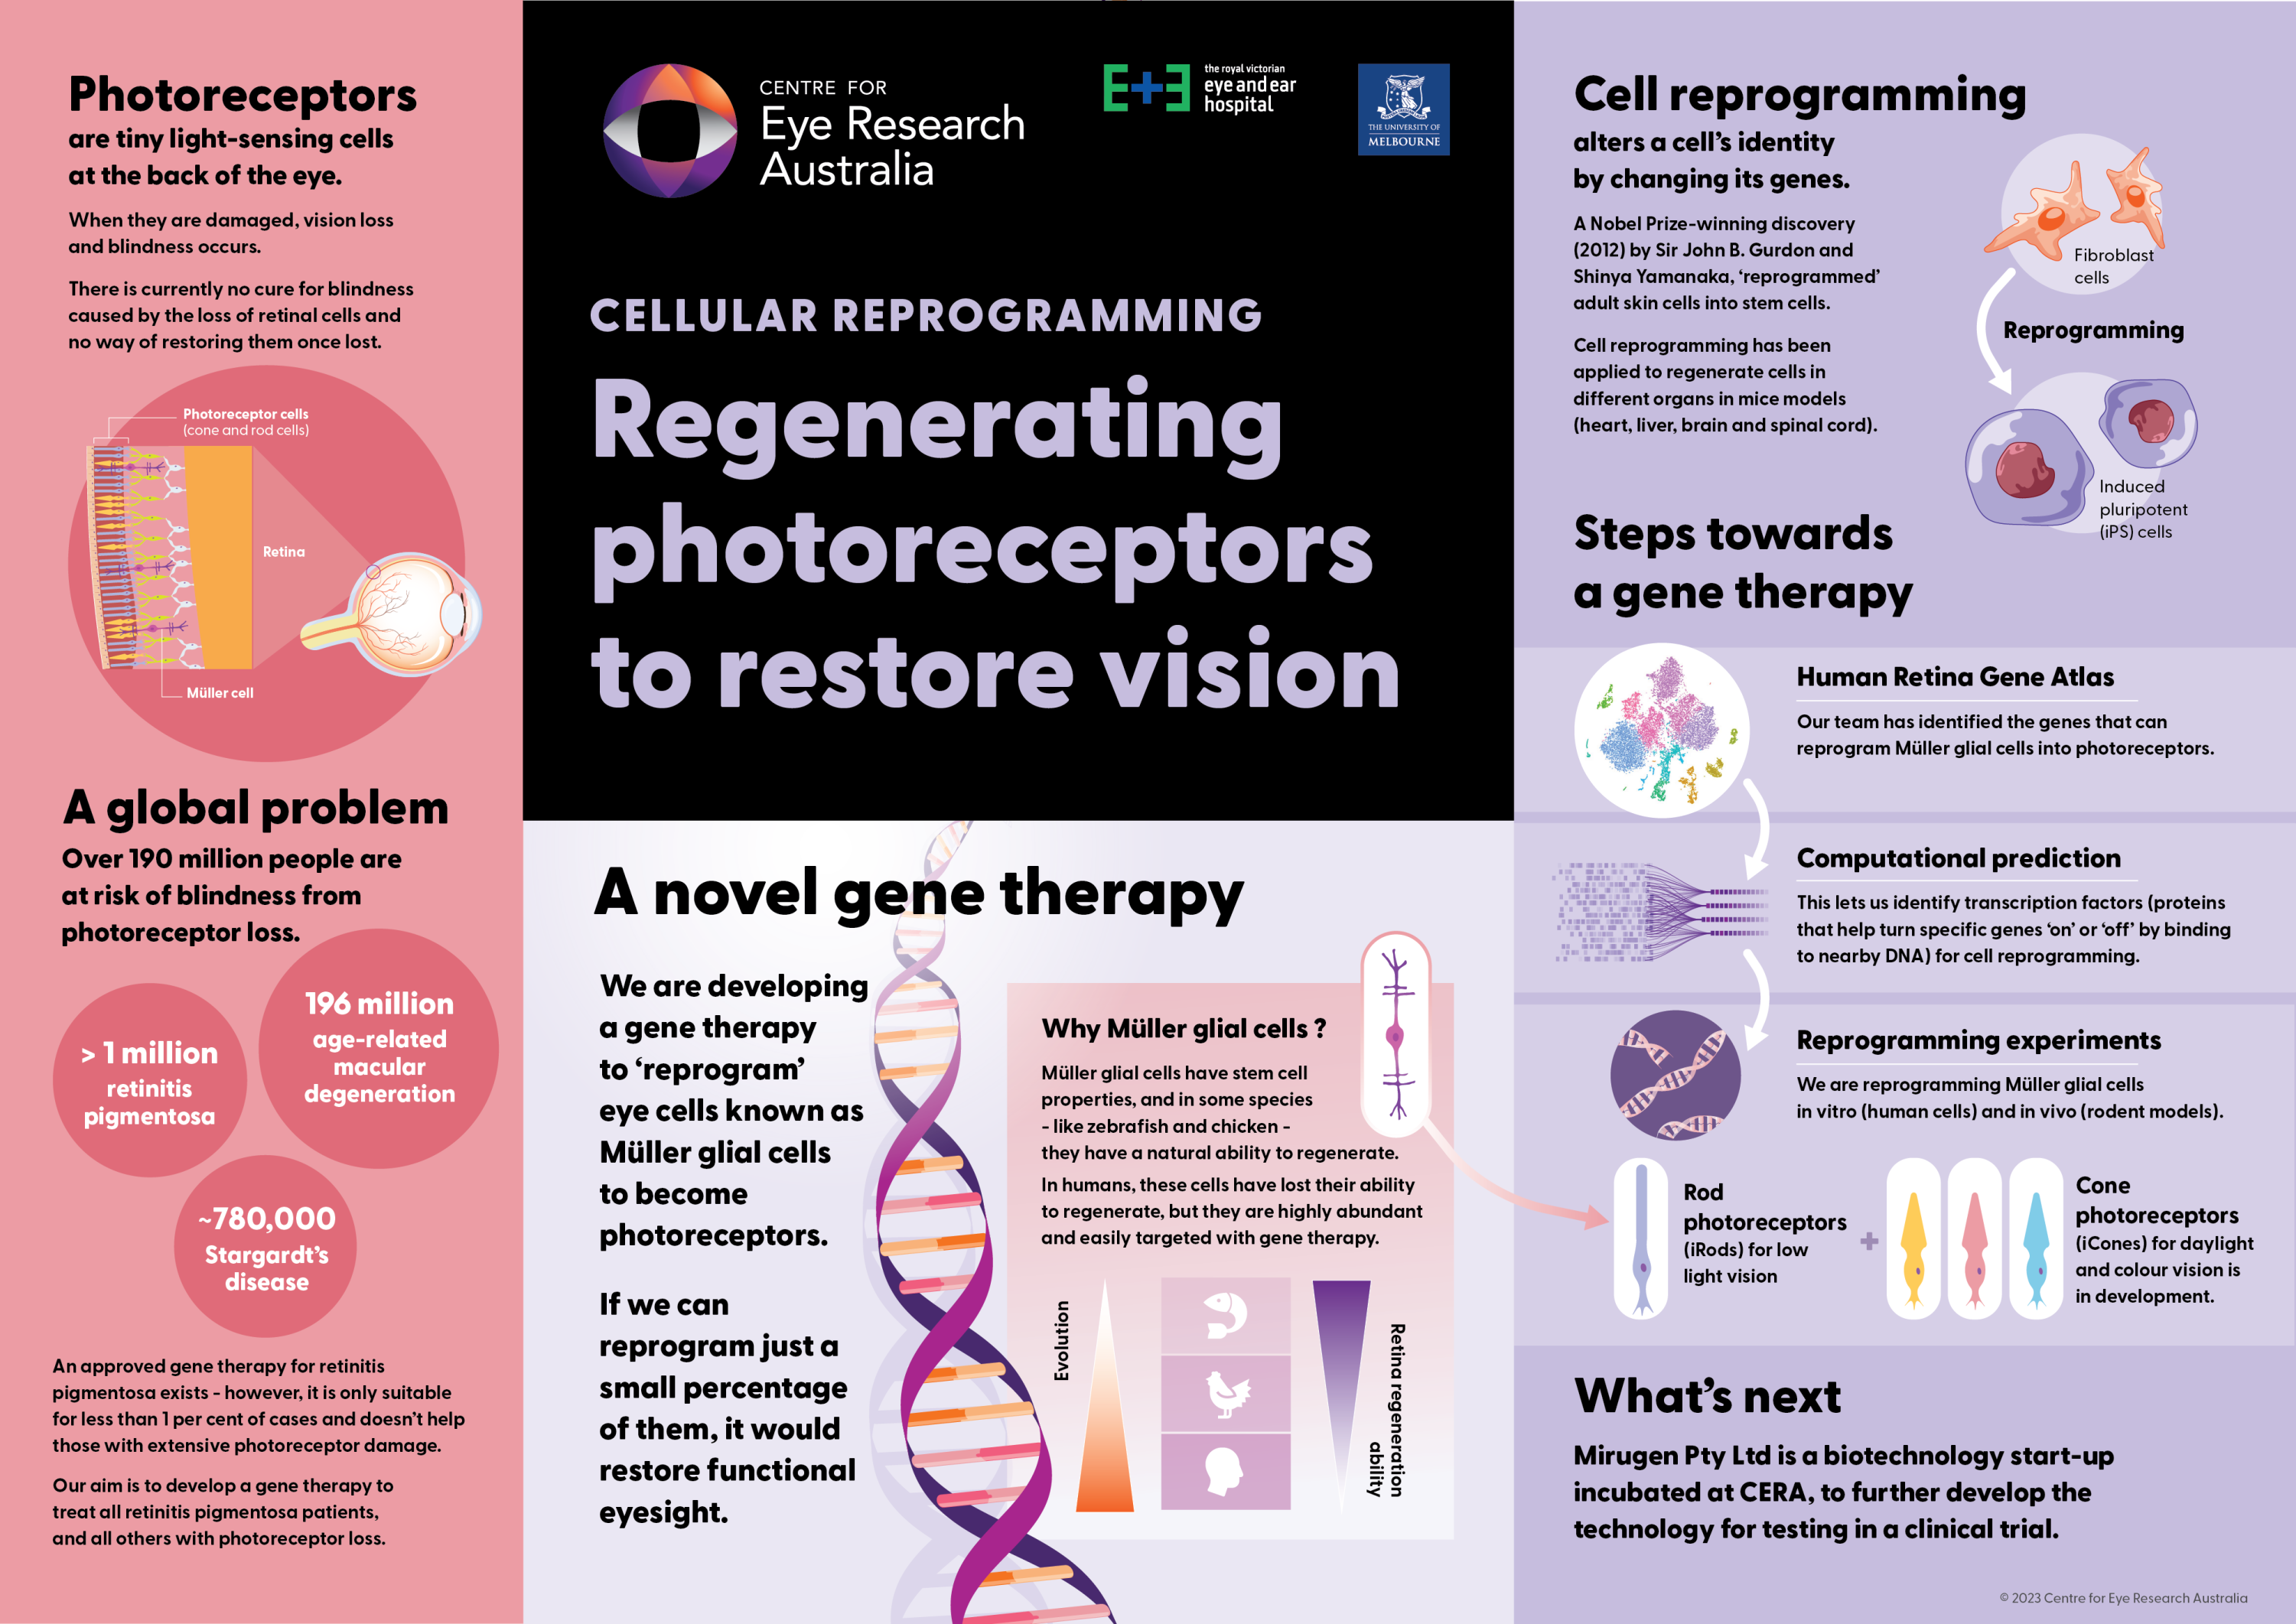
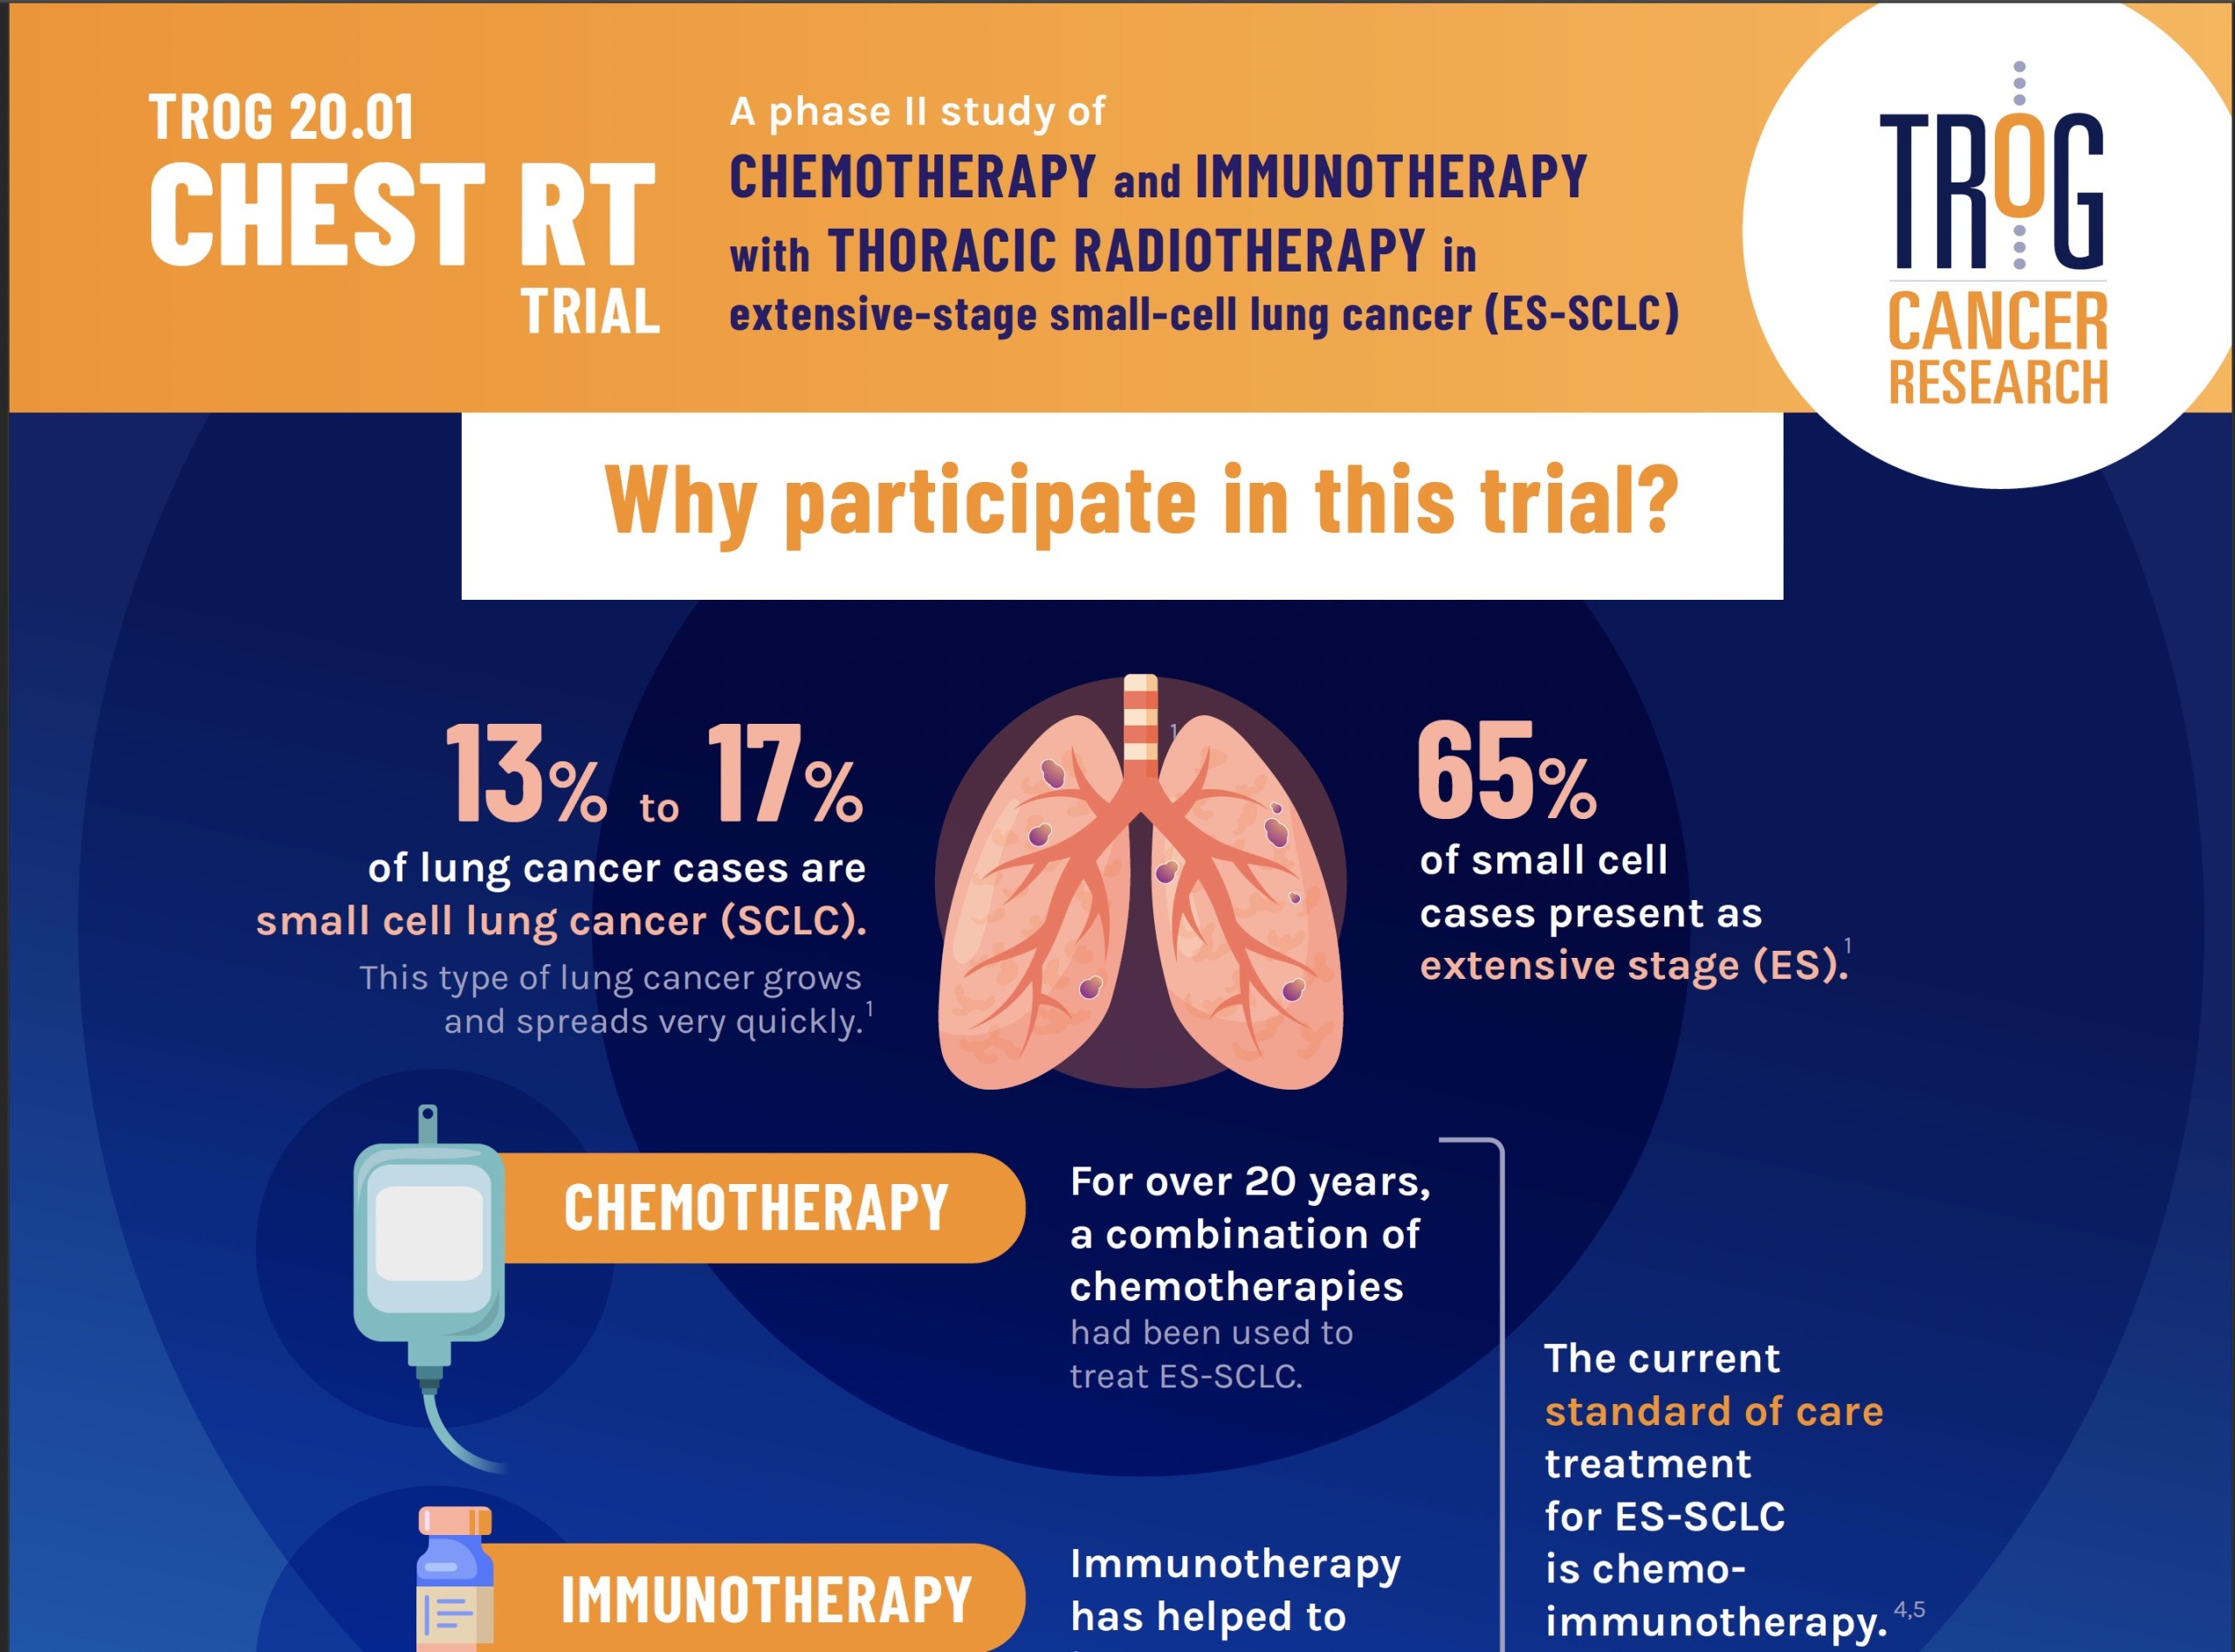
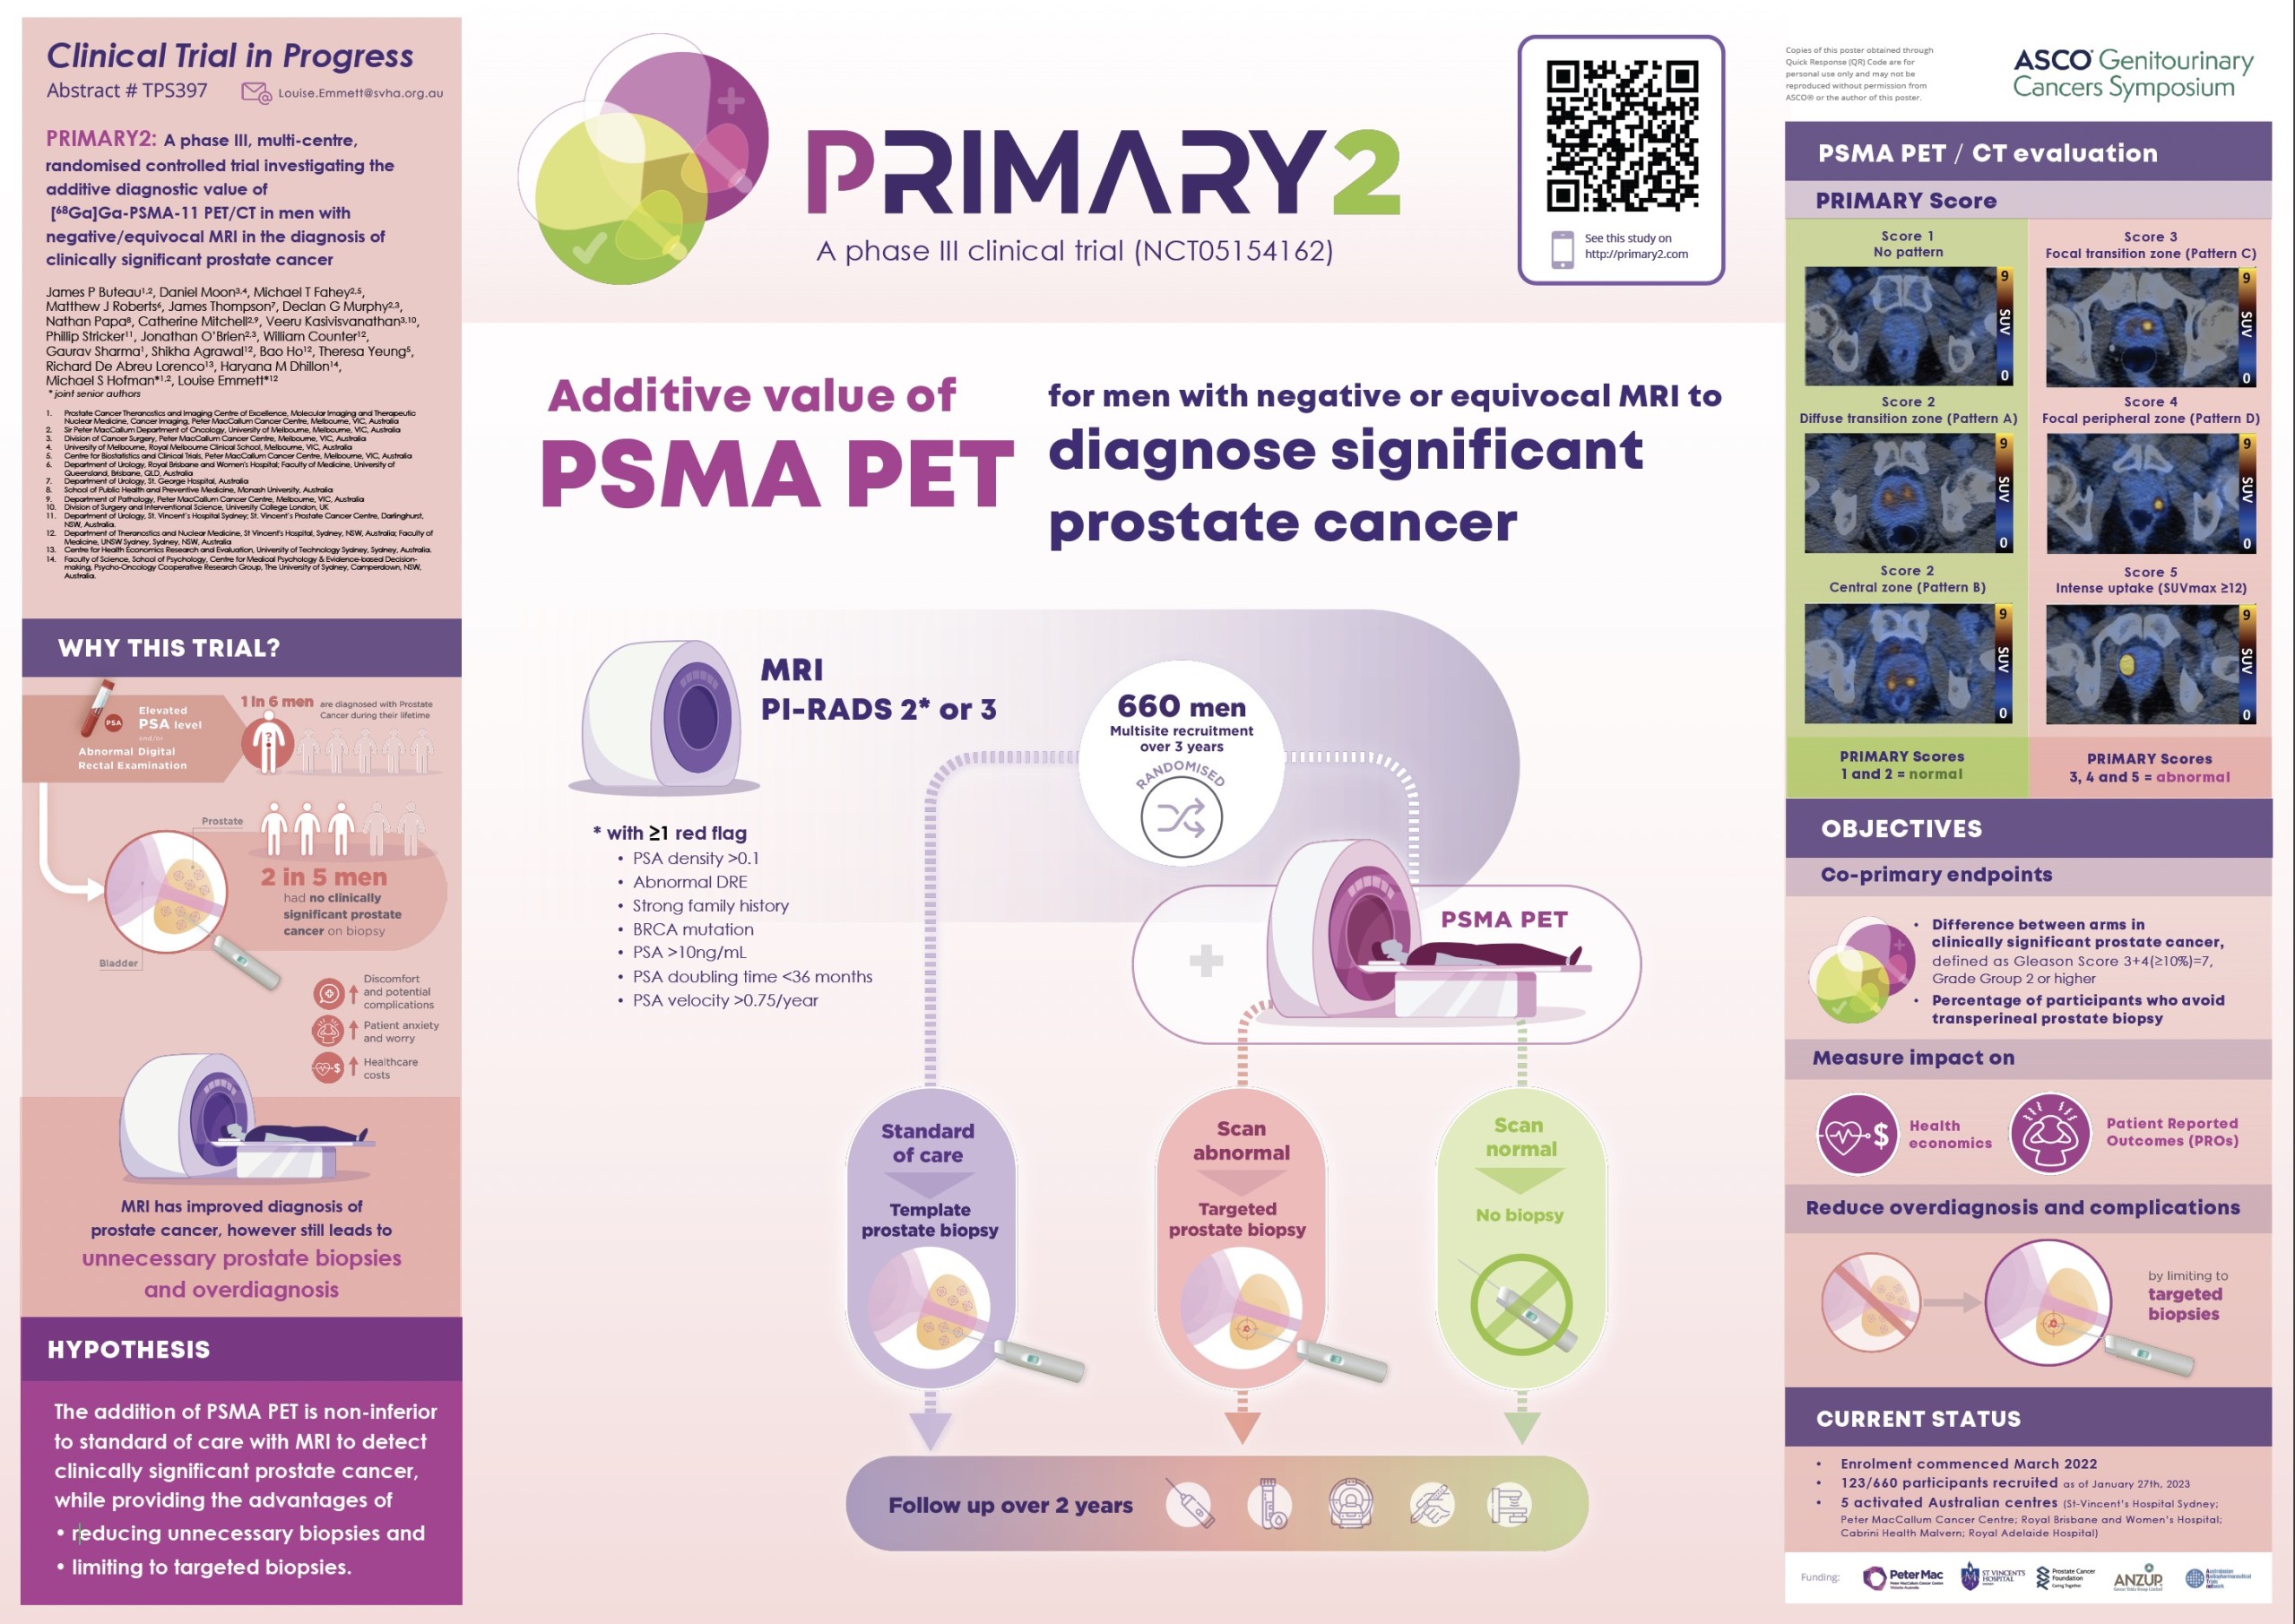
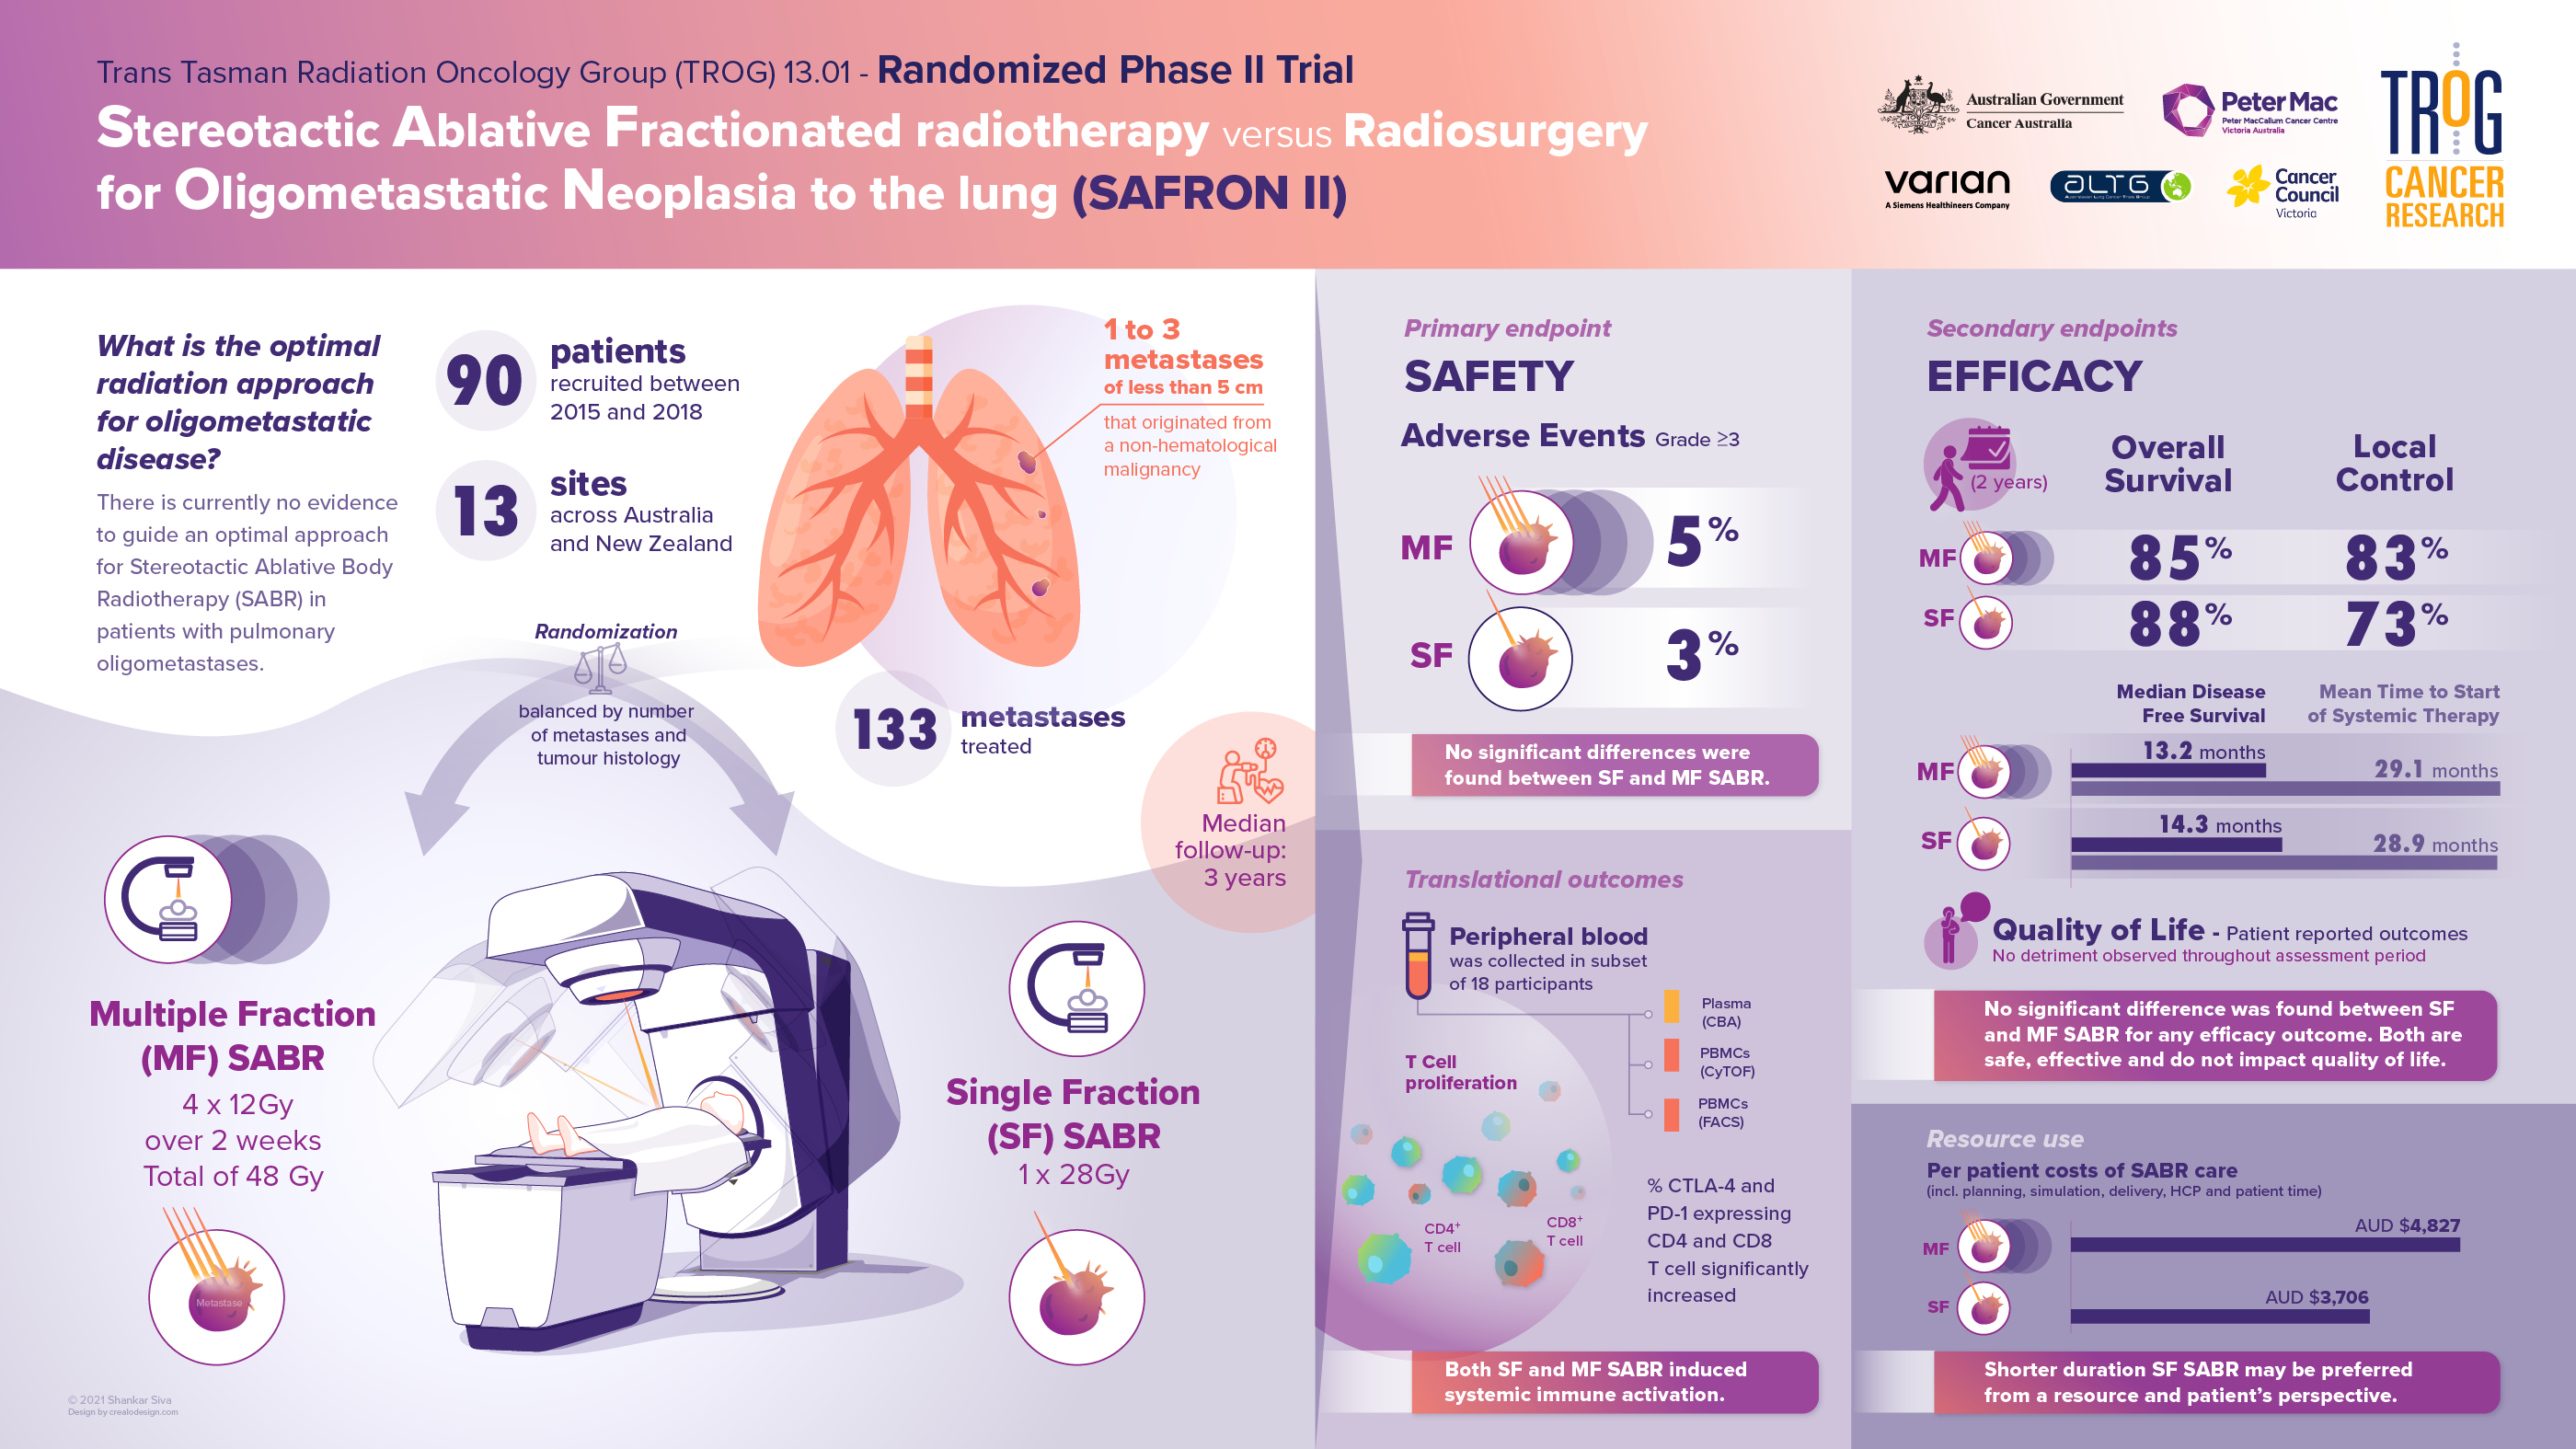
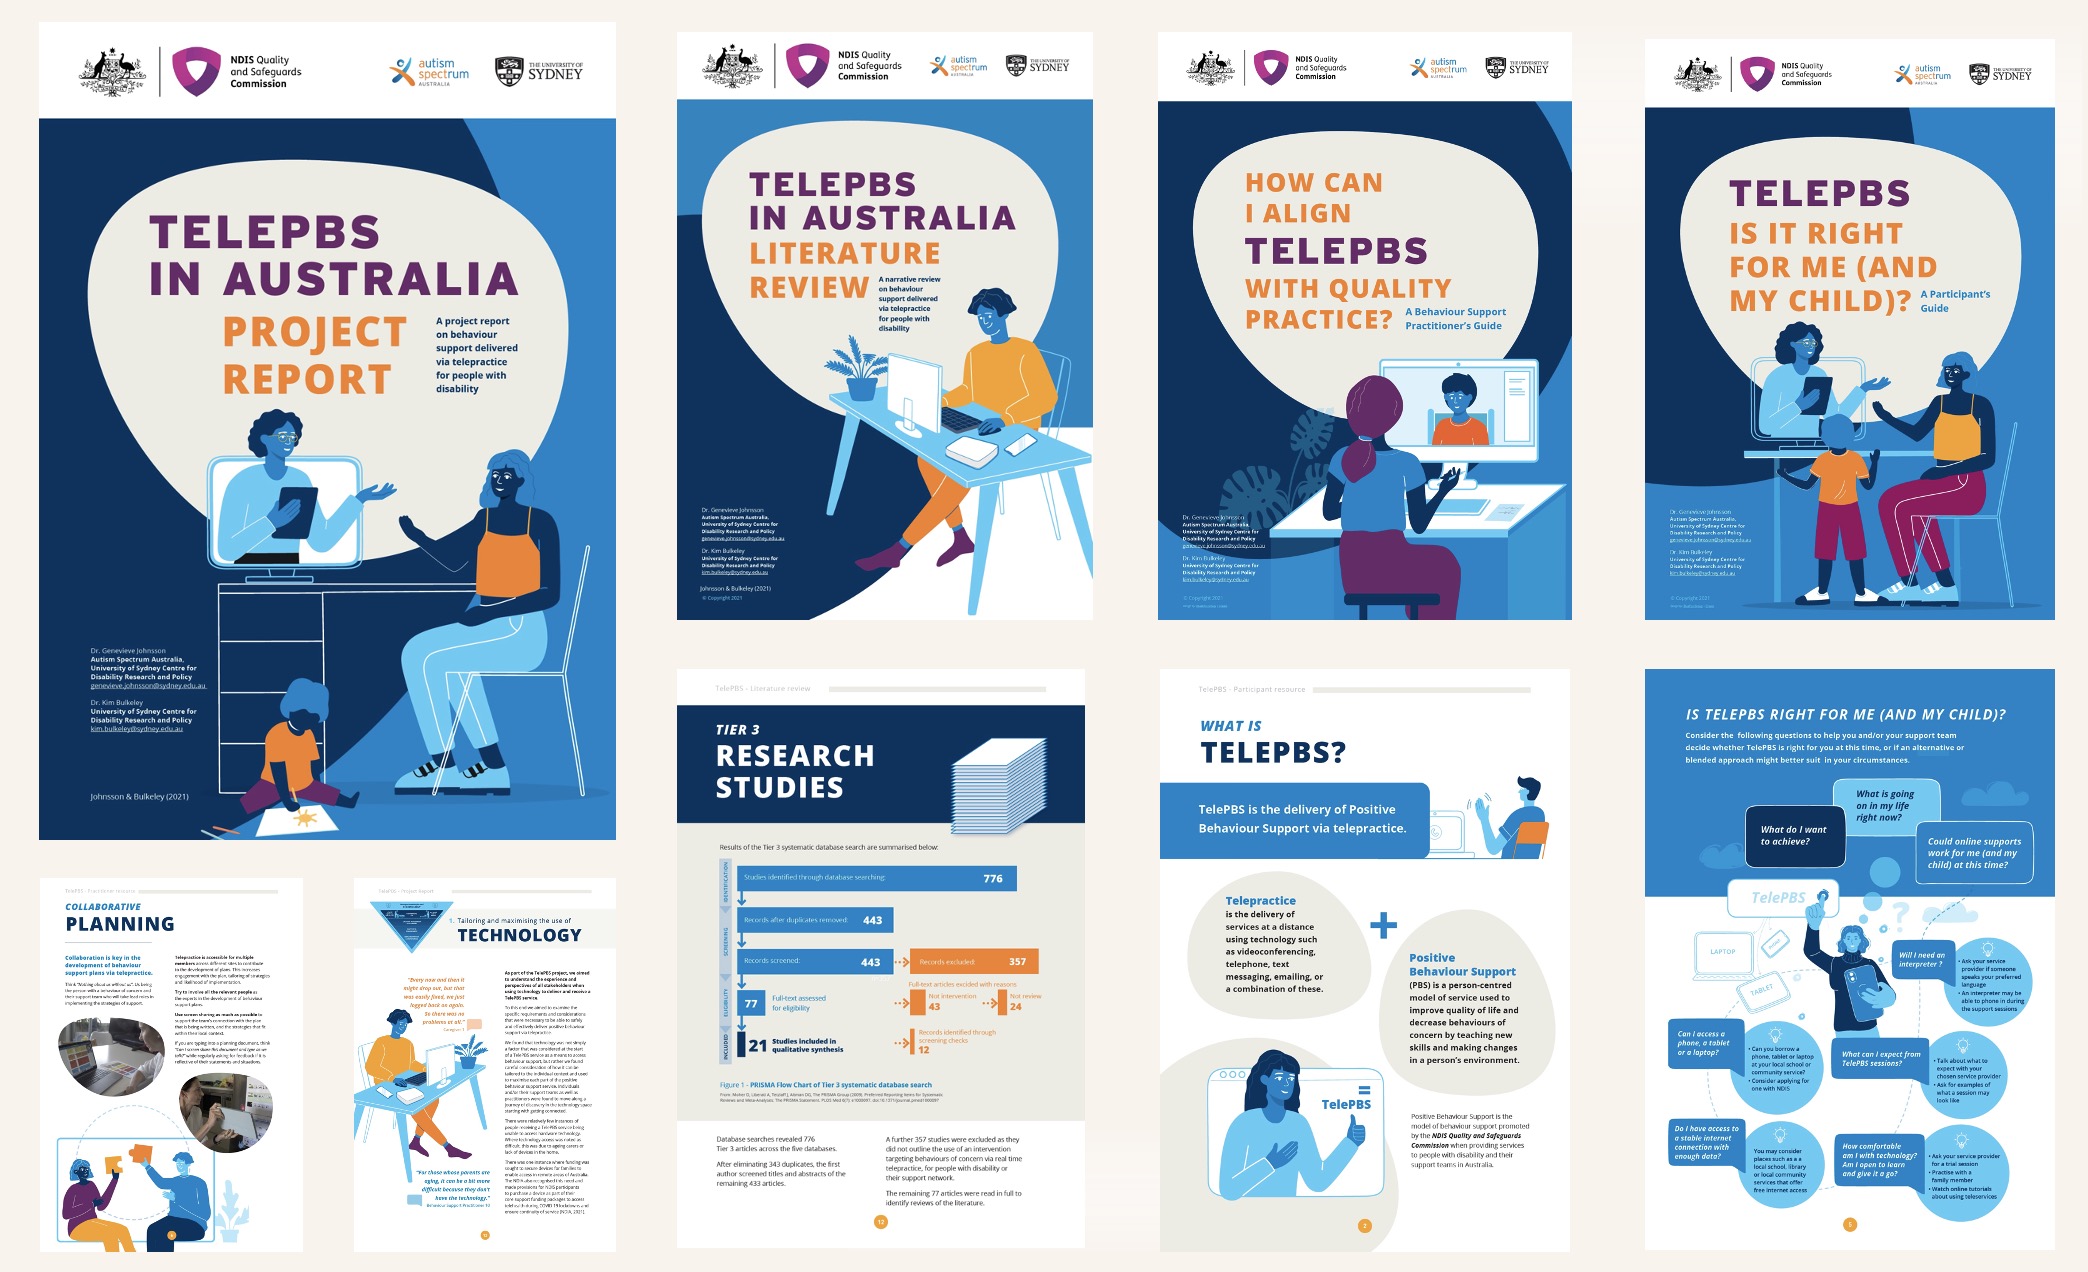
Science / Research
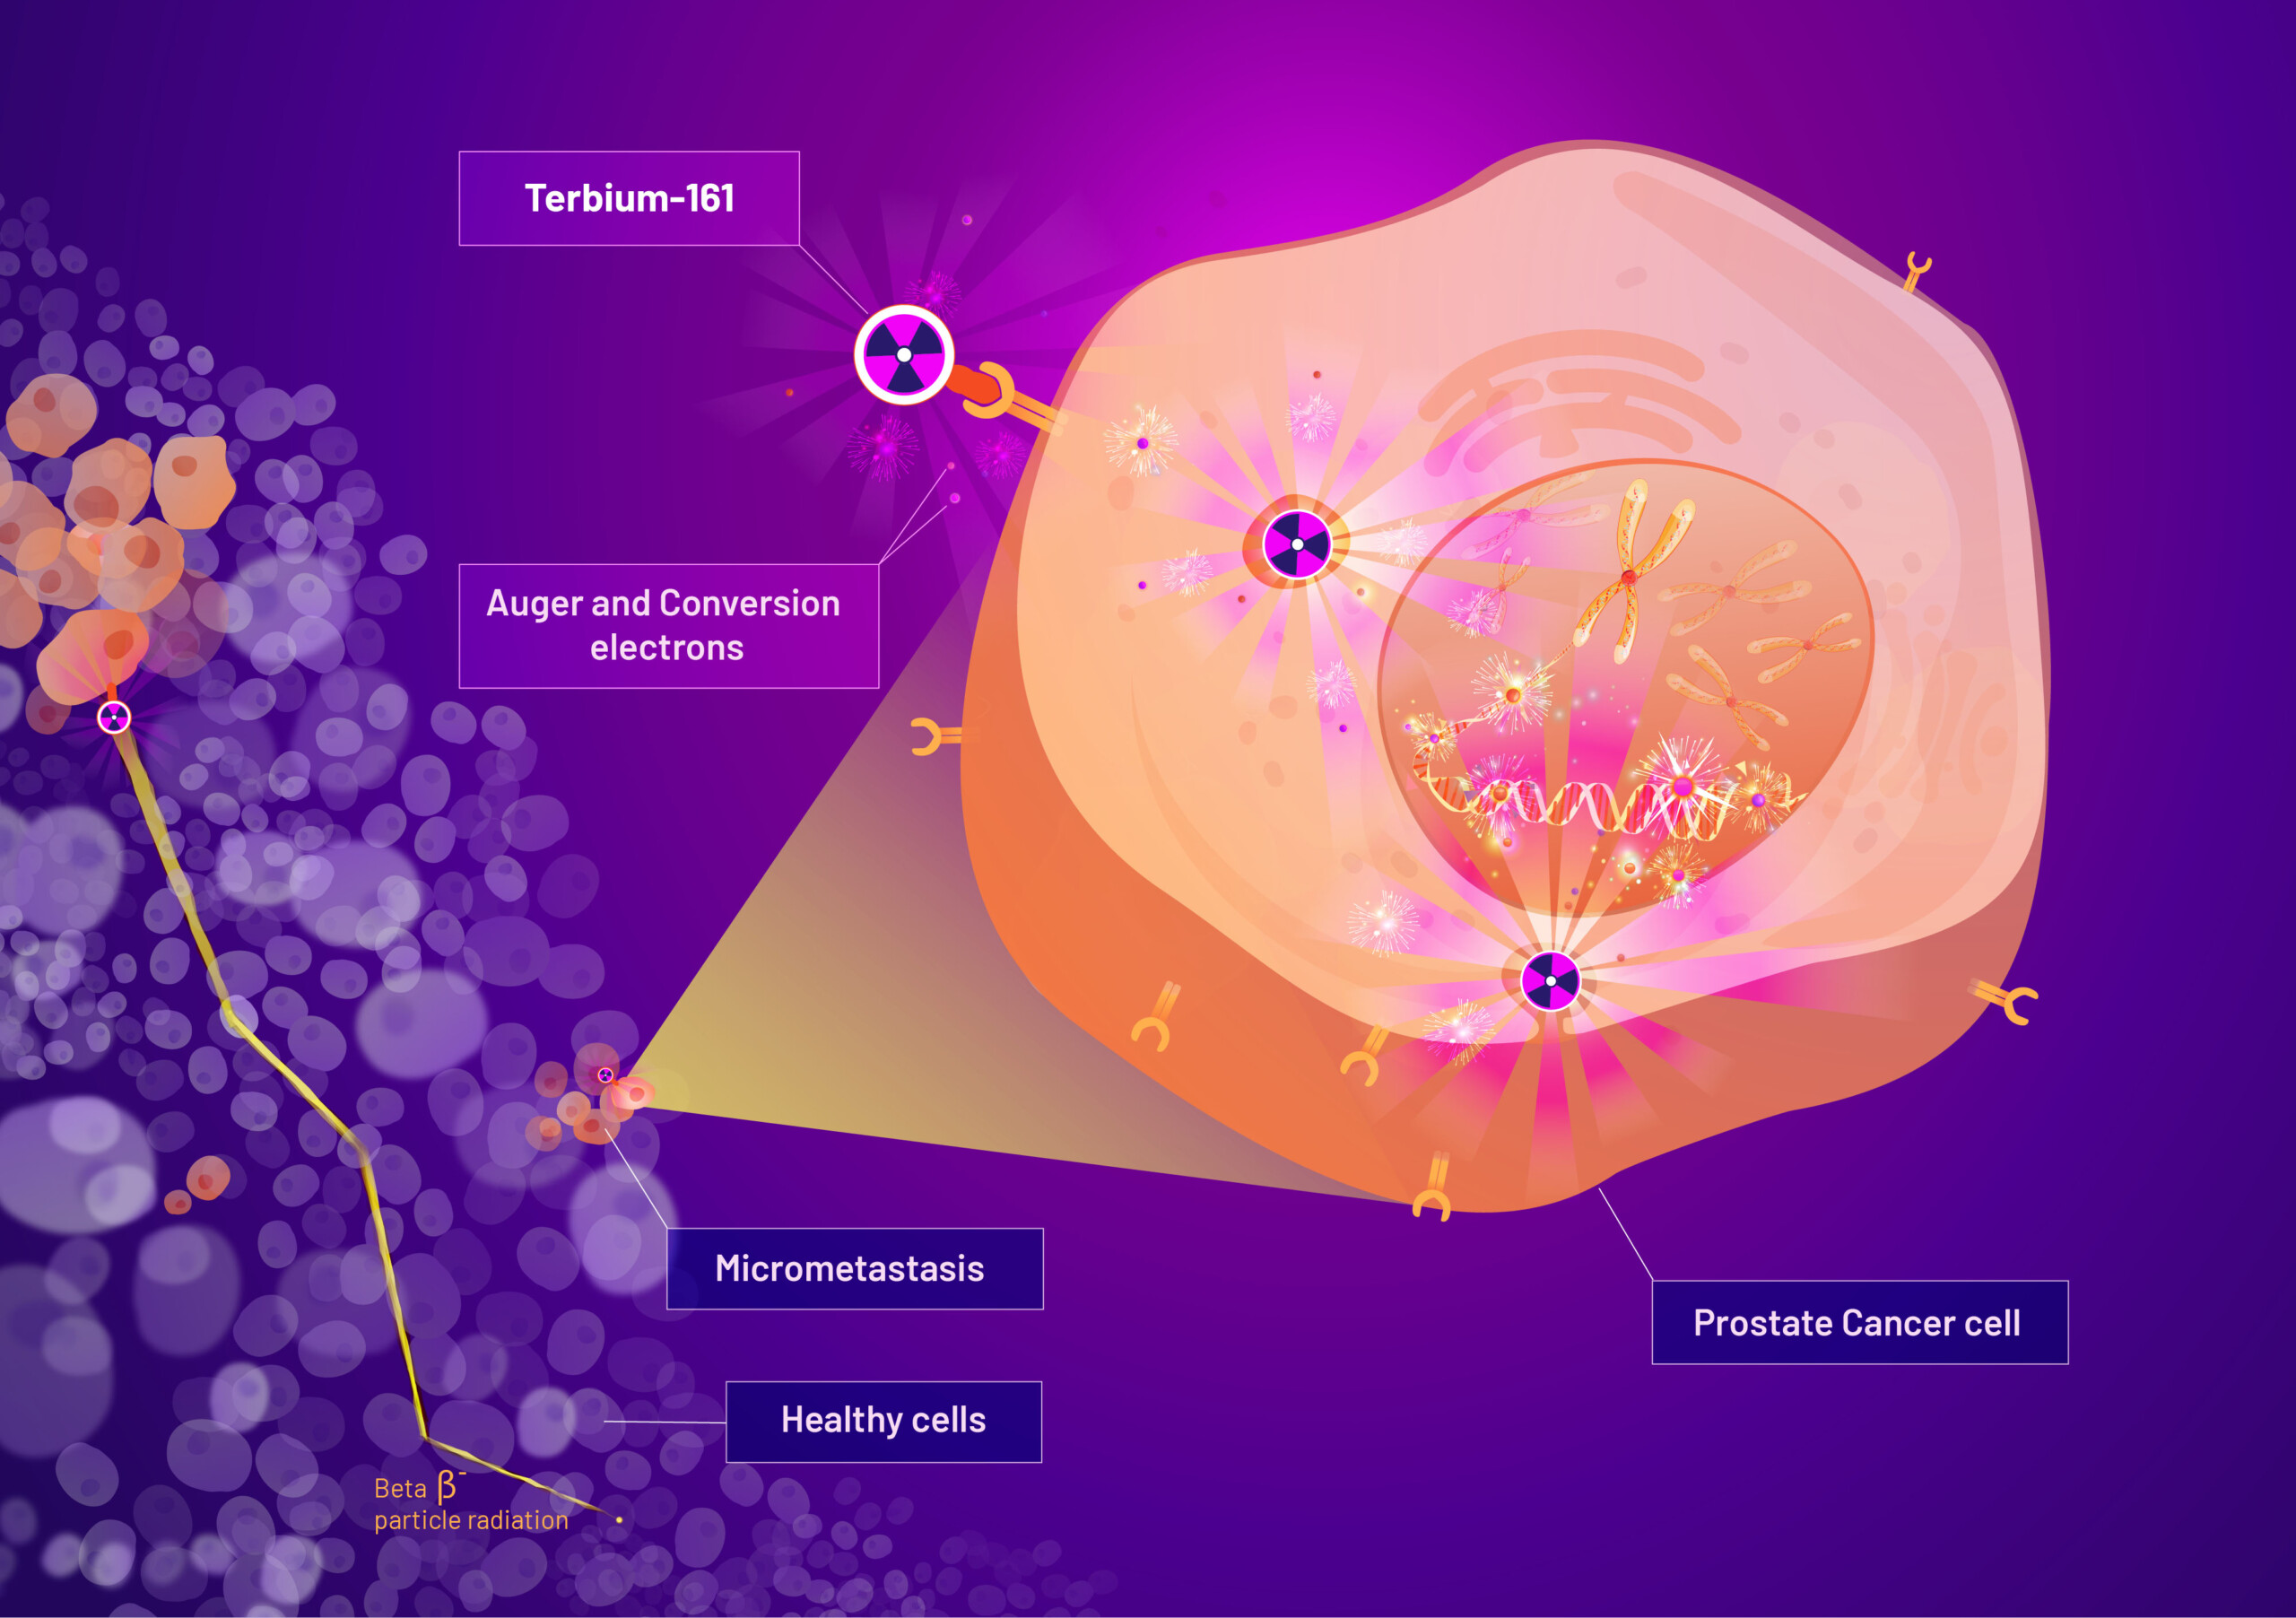
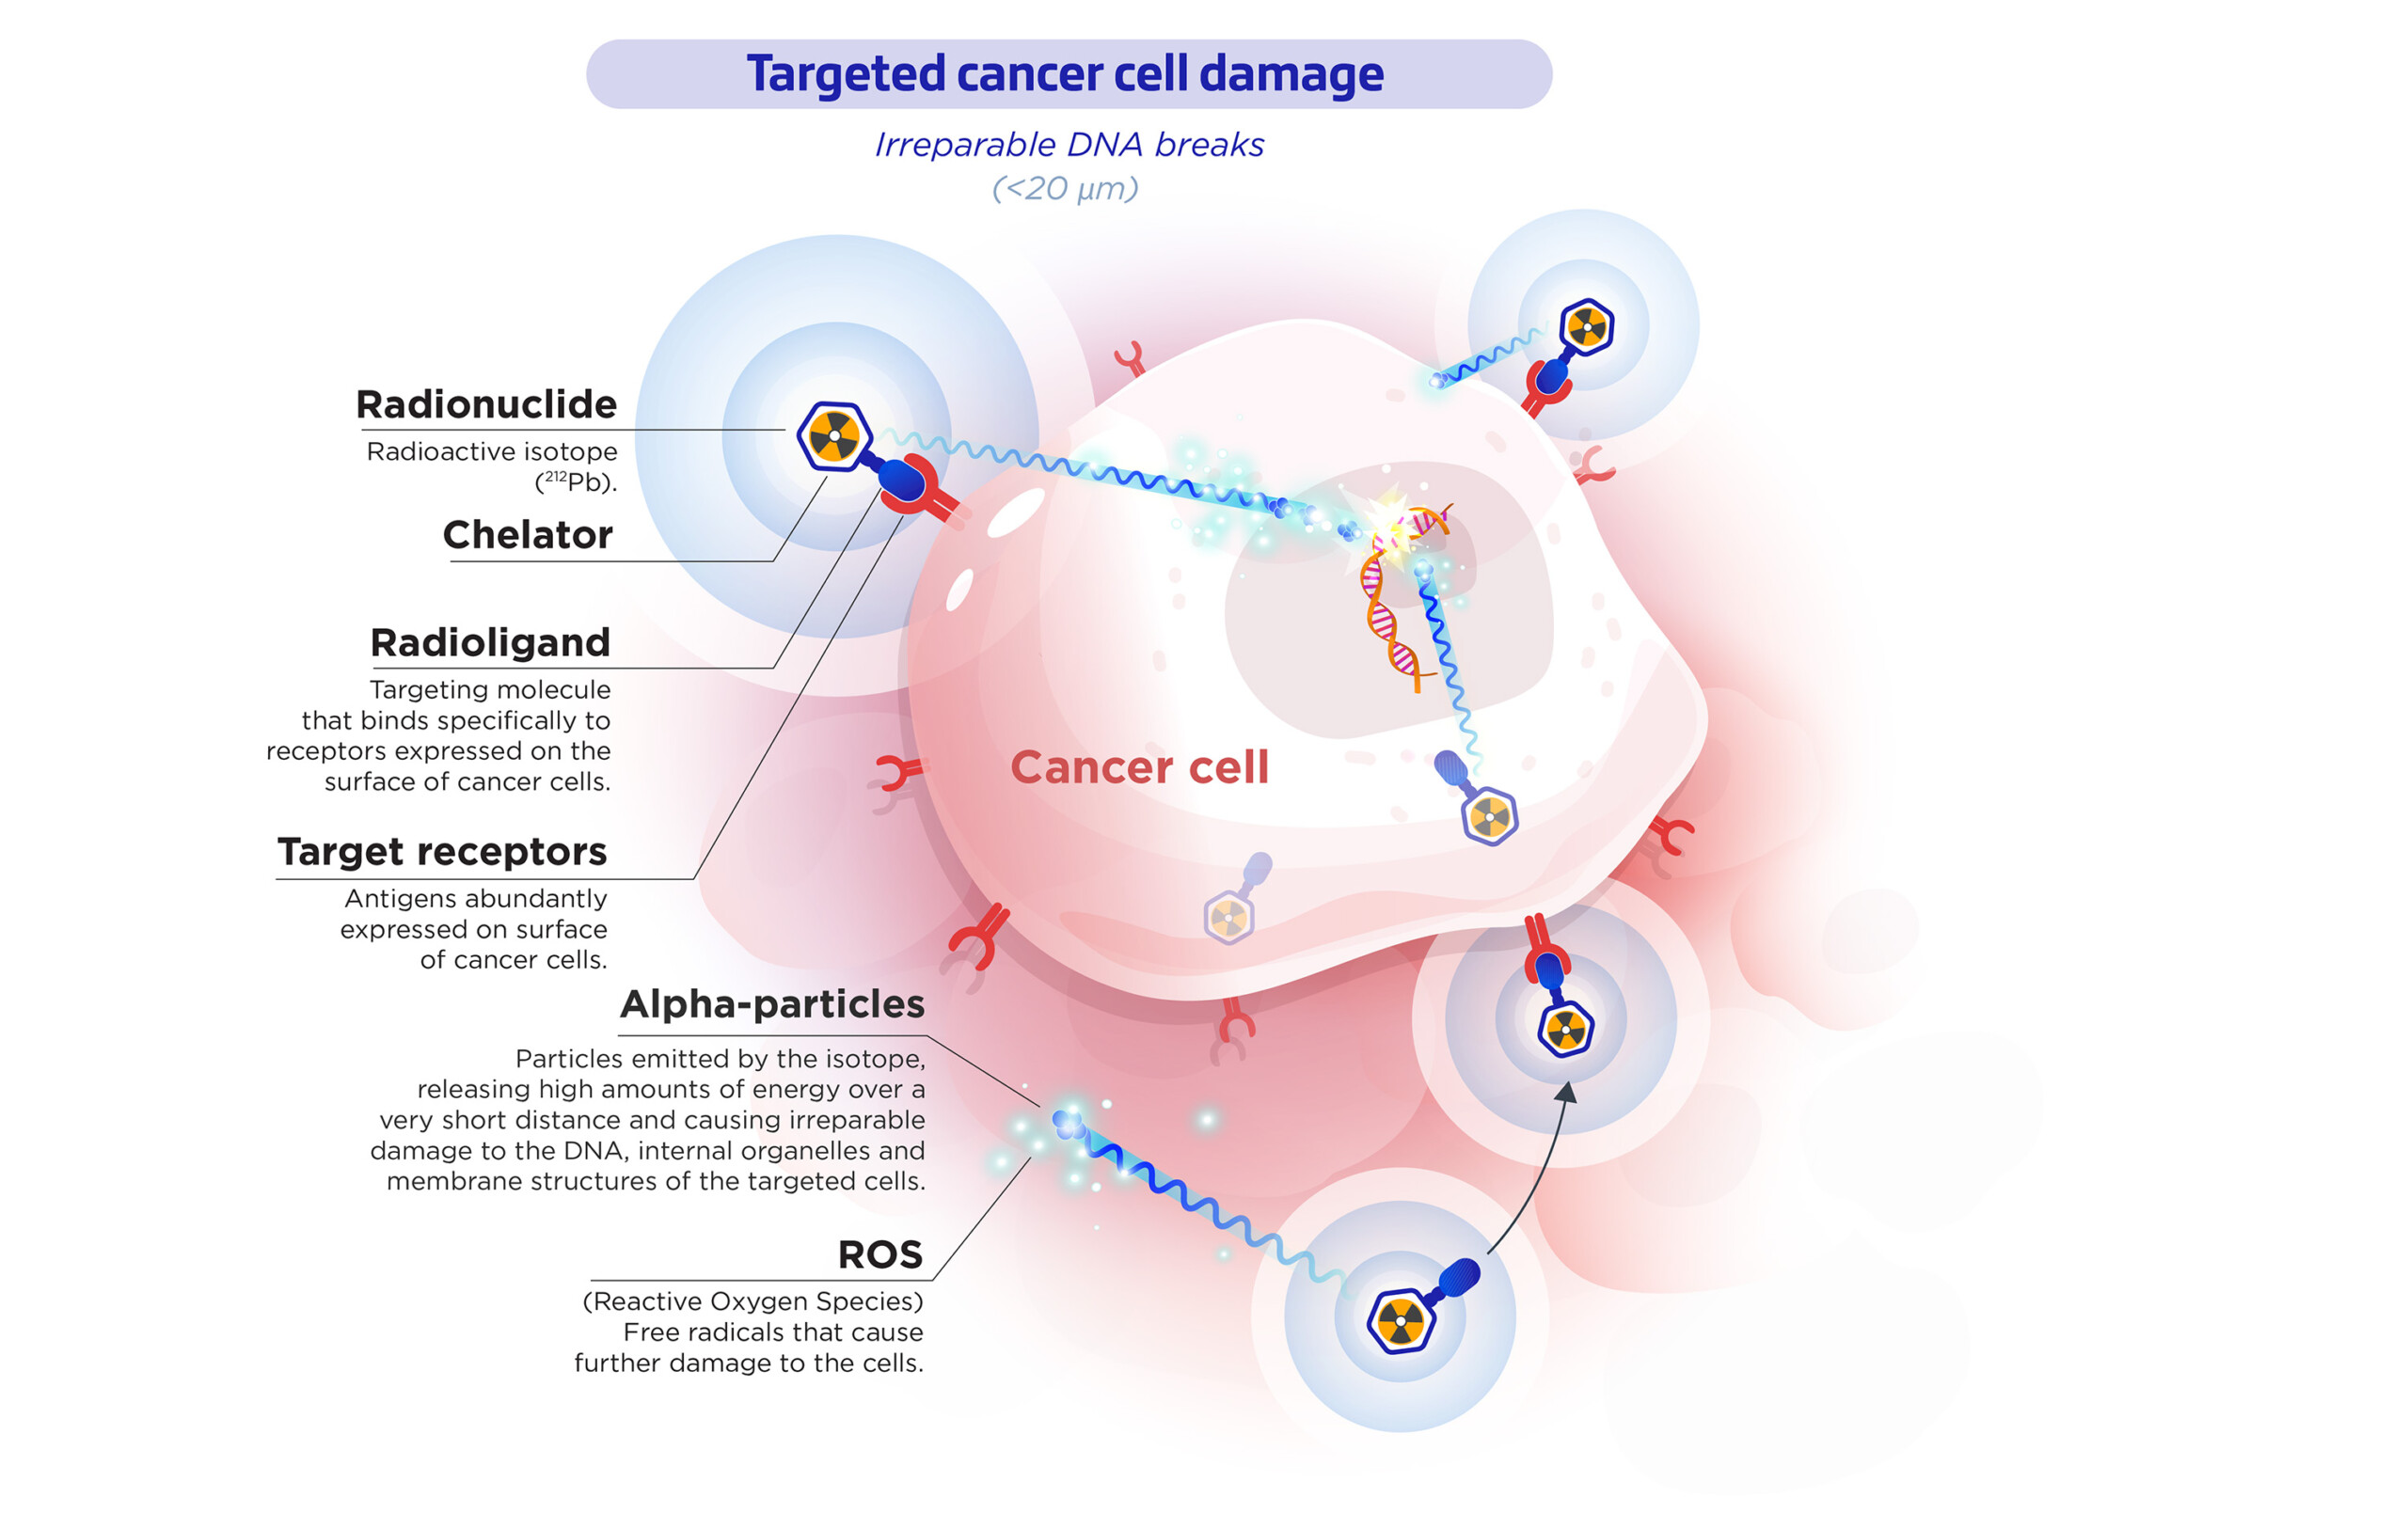
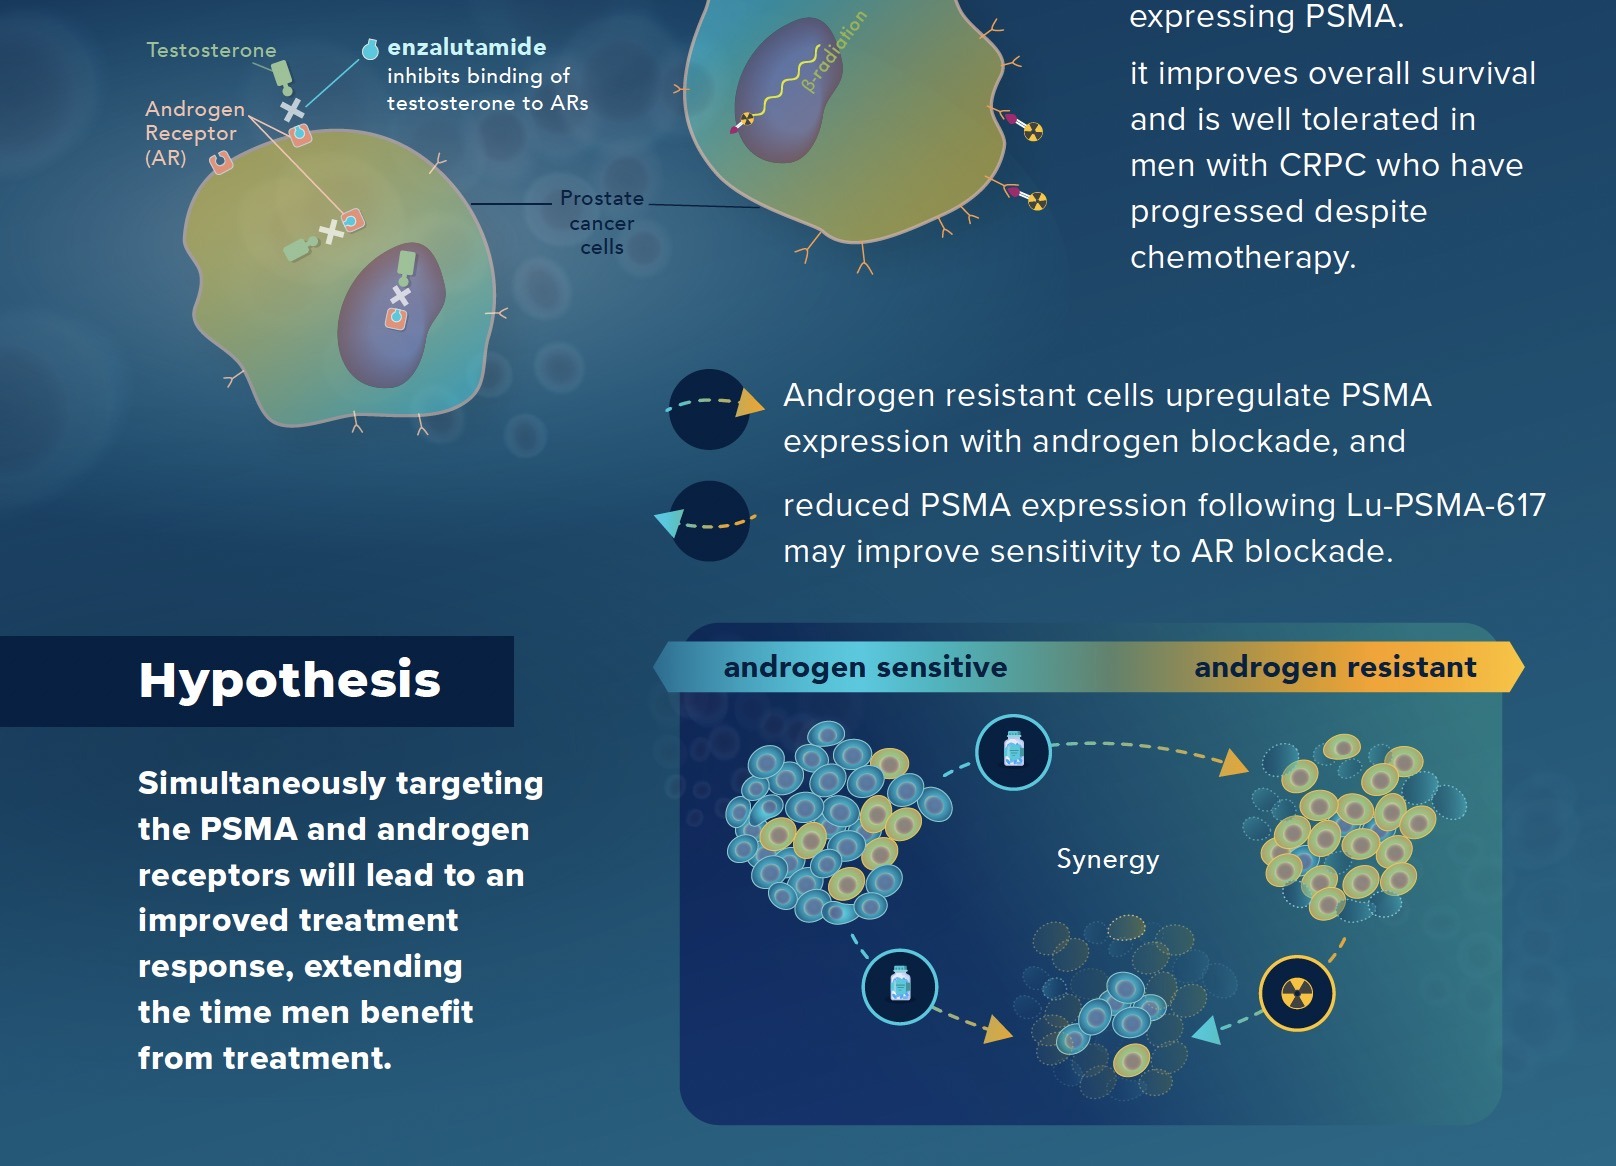
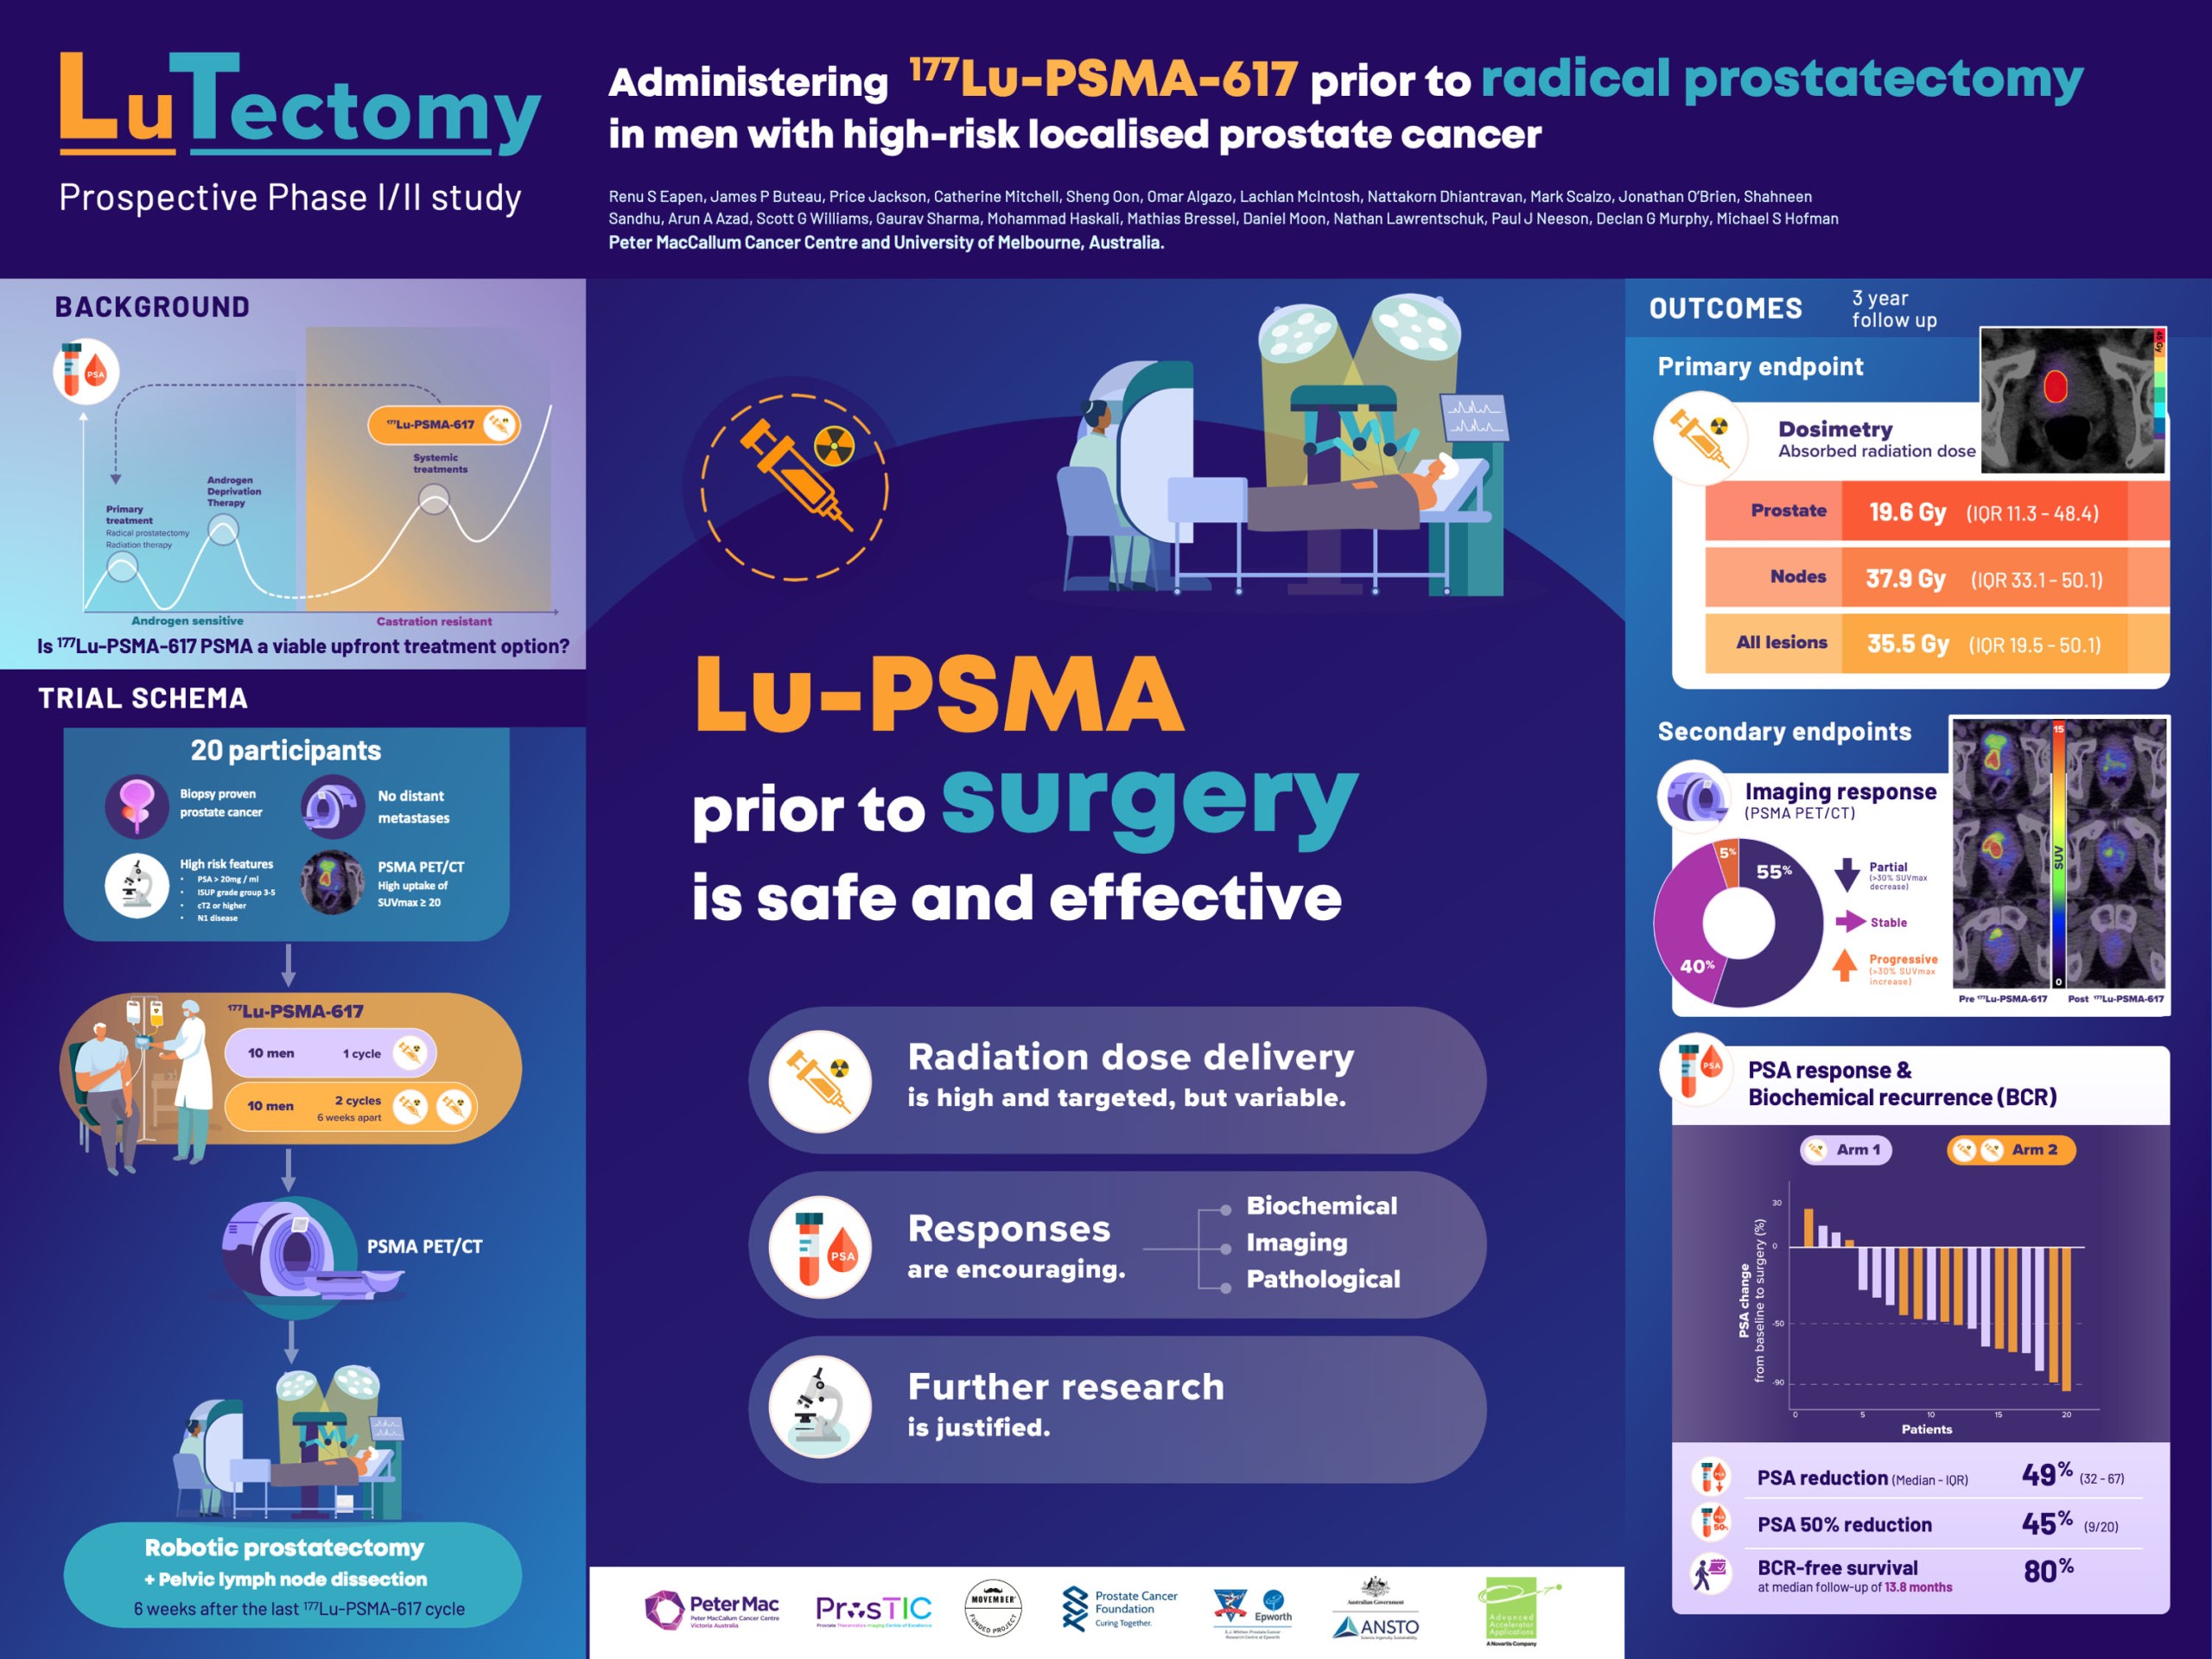
Graphic abstracts
Research findings
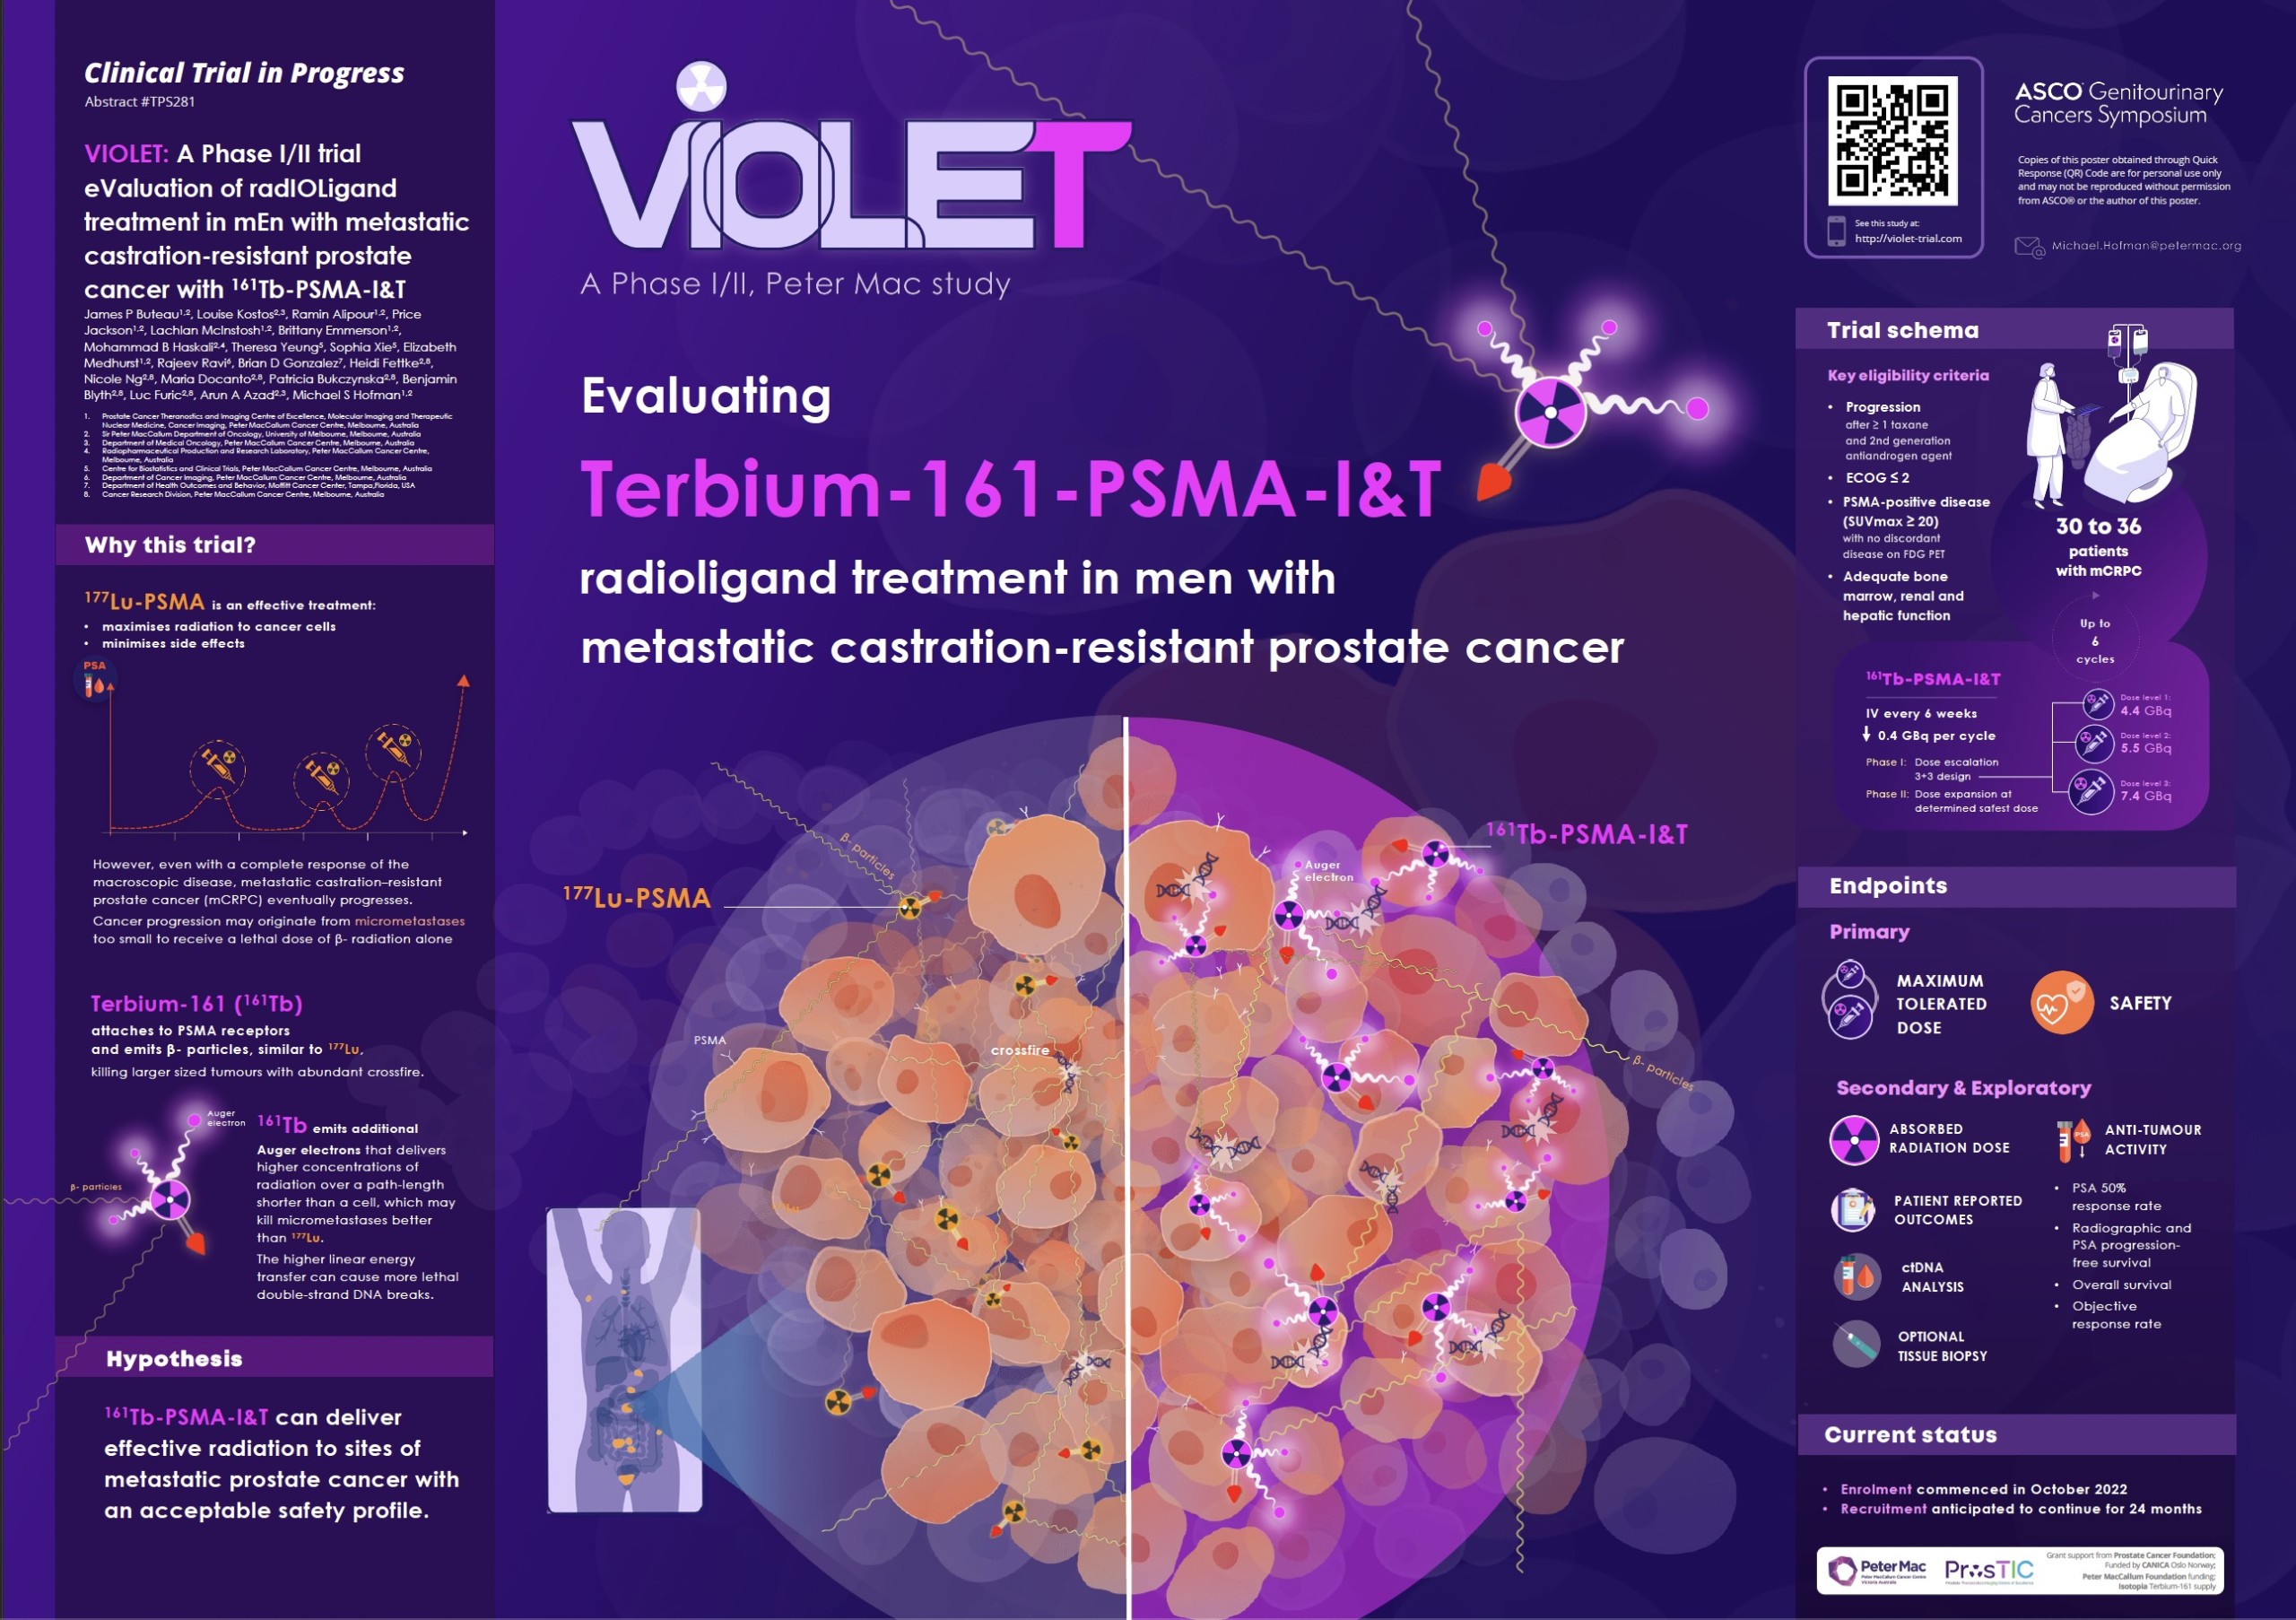
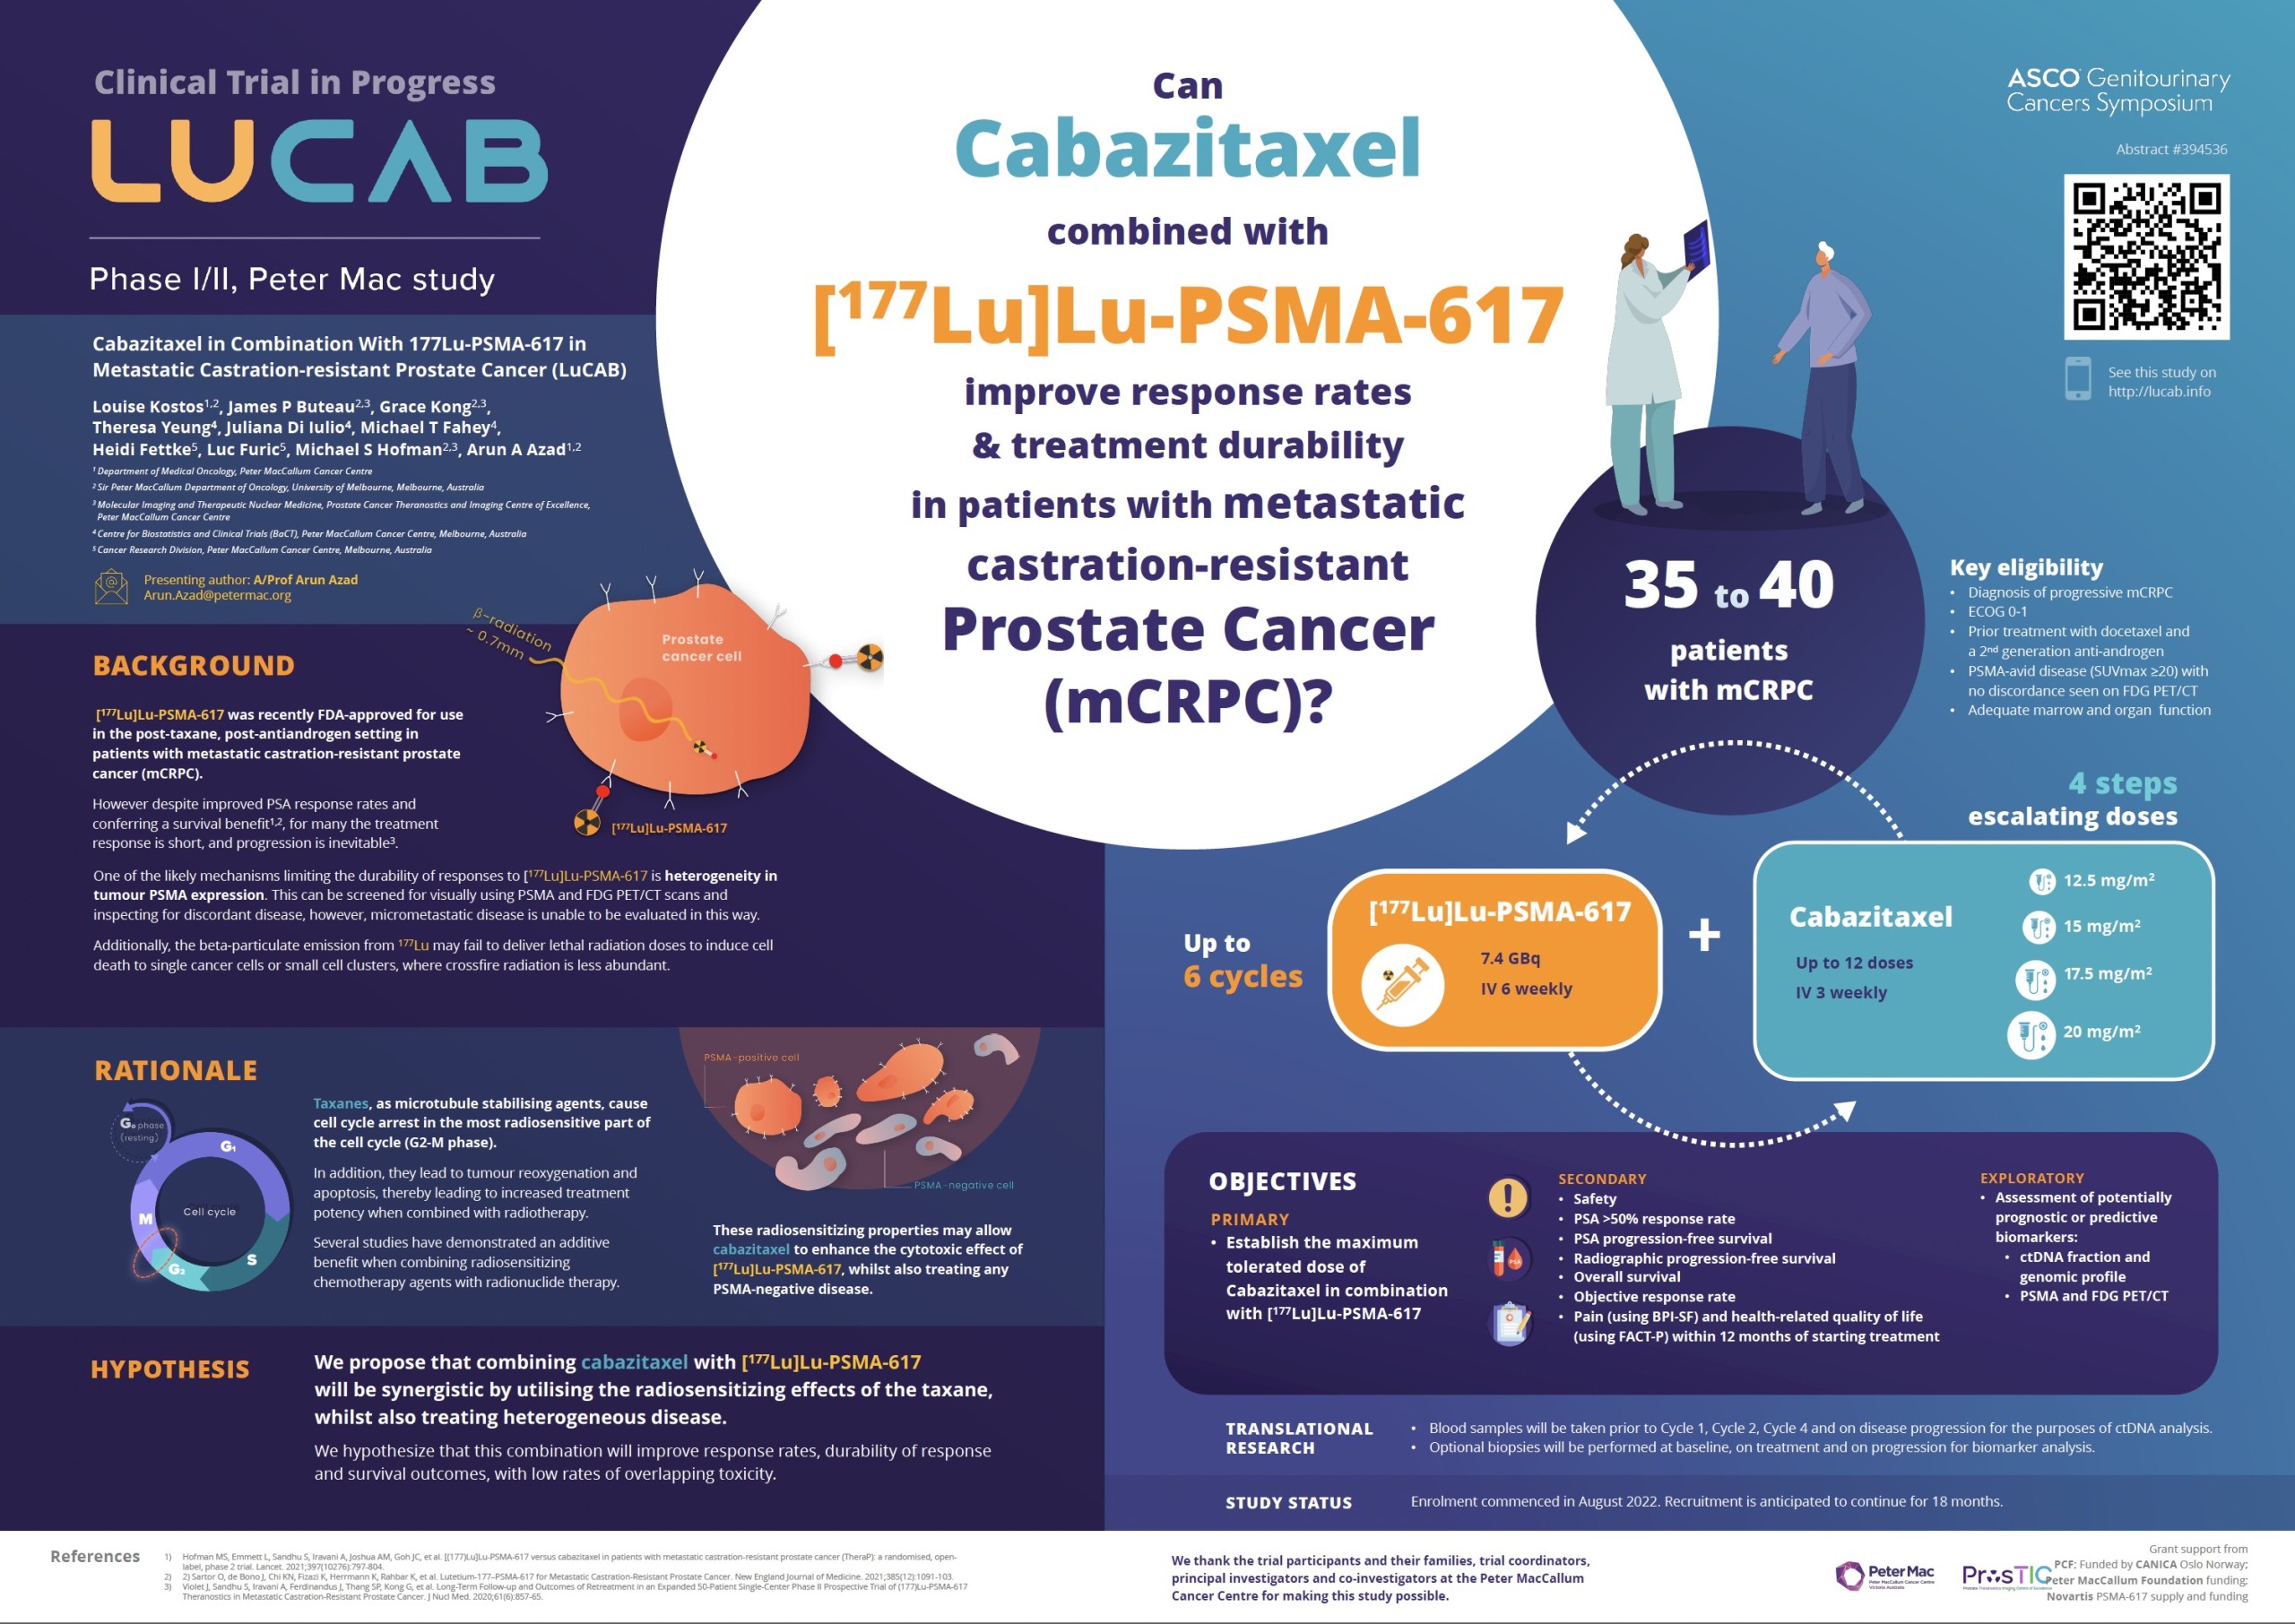
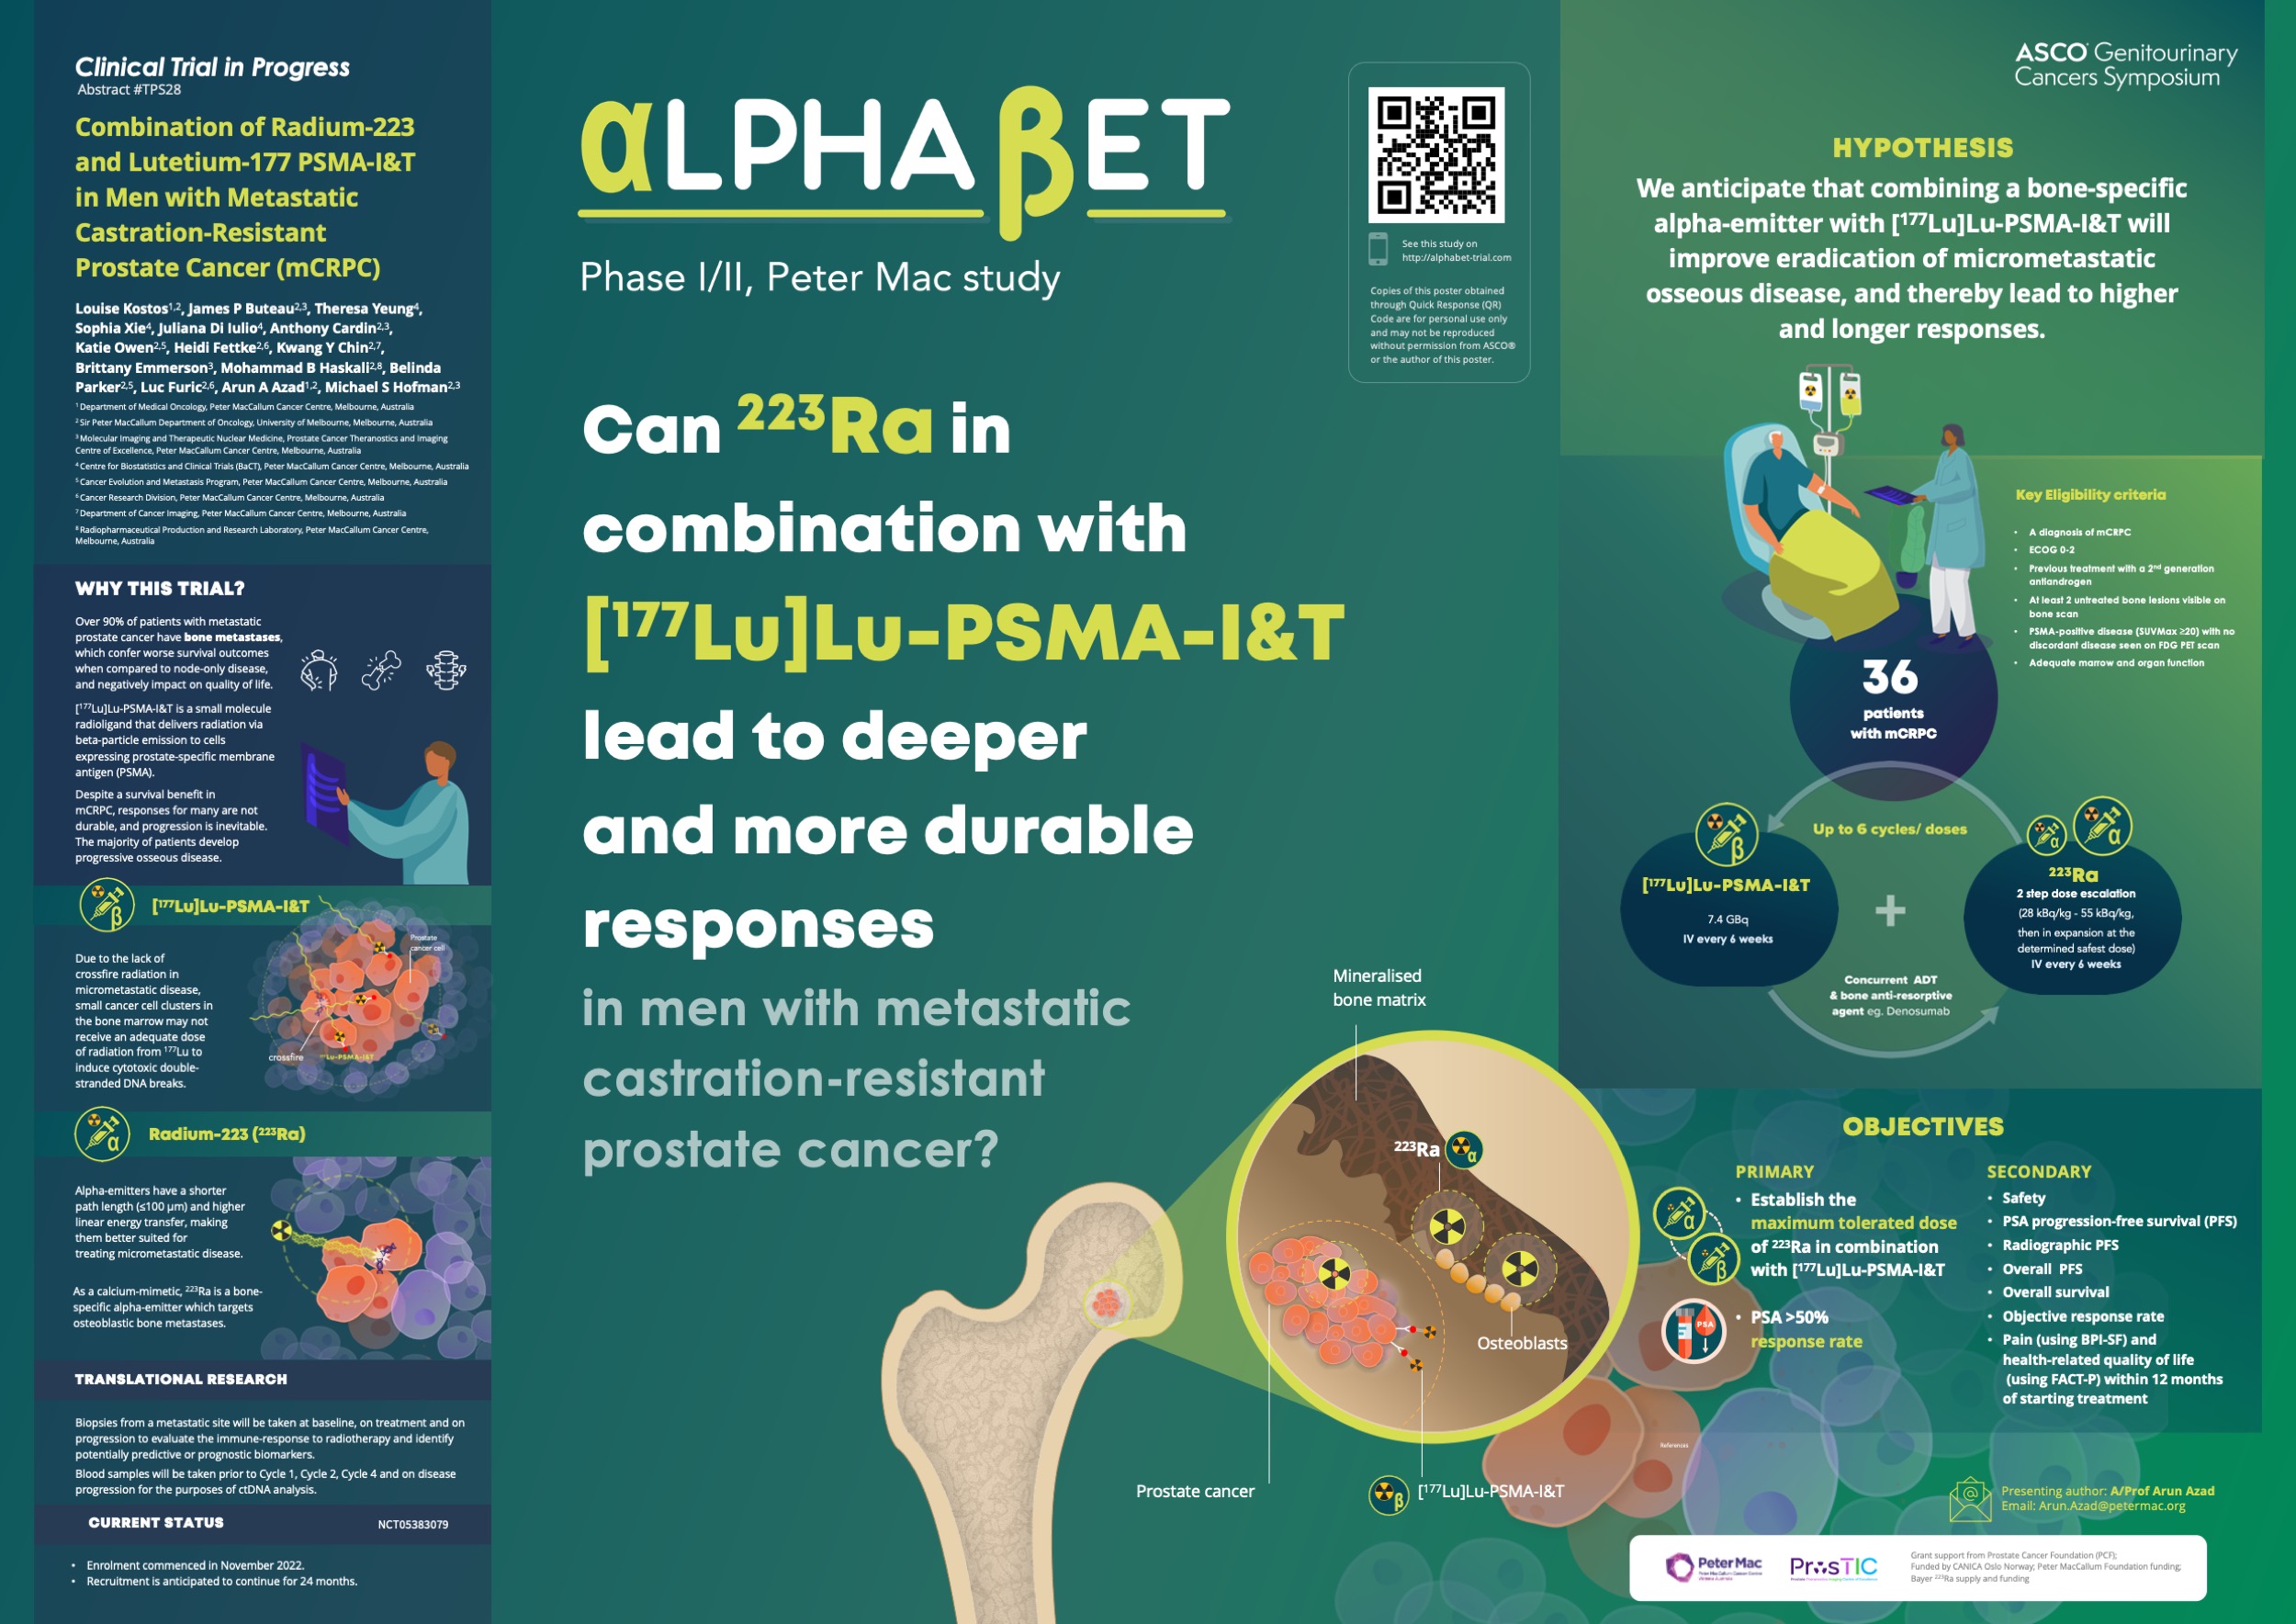
Clinical trials
Grant applications
Publications
Knowledge Translation
Patient-facing information
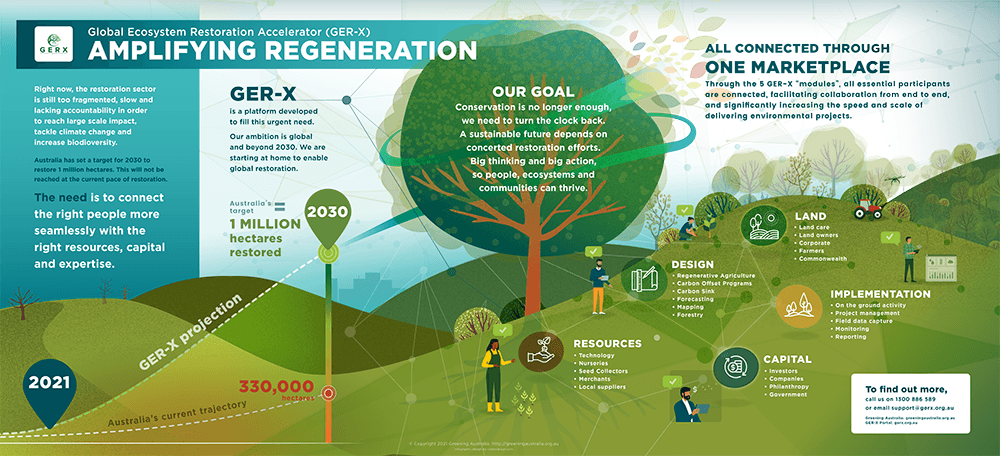
Infographic design for
Business applications
Strategic narratives
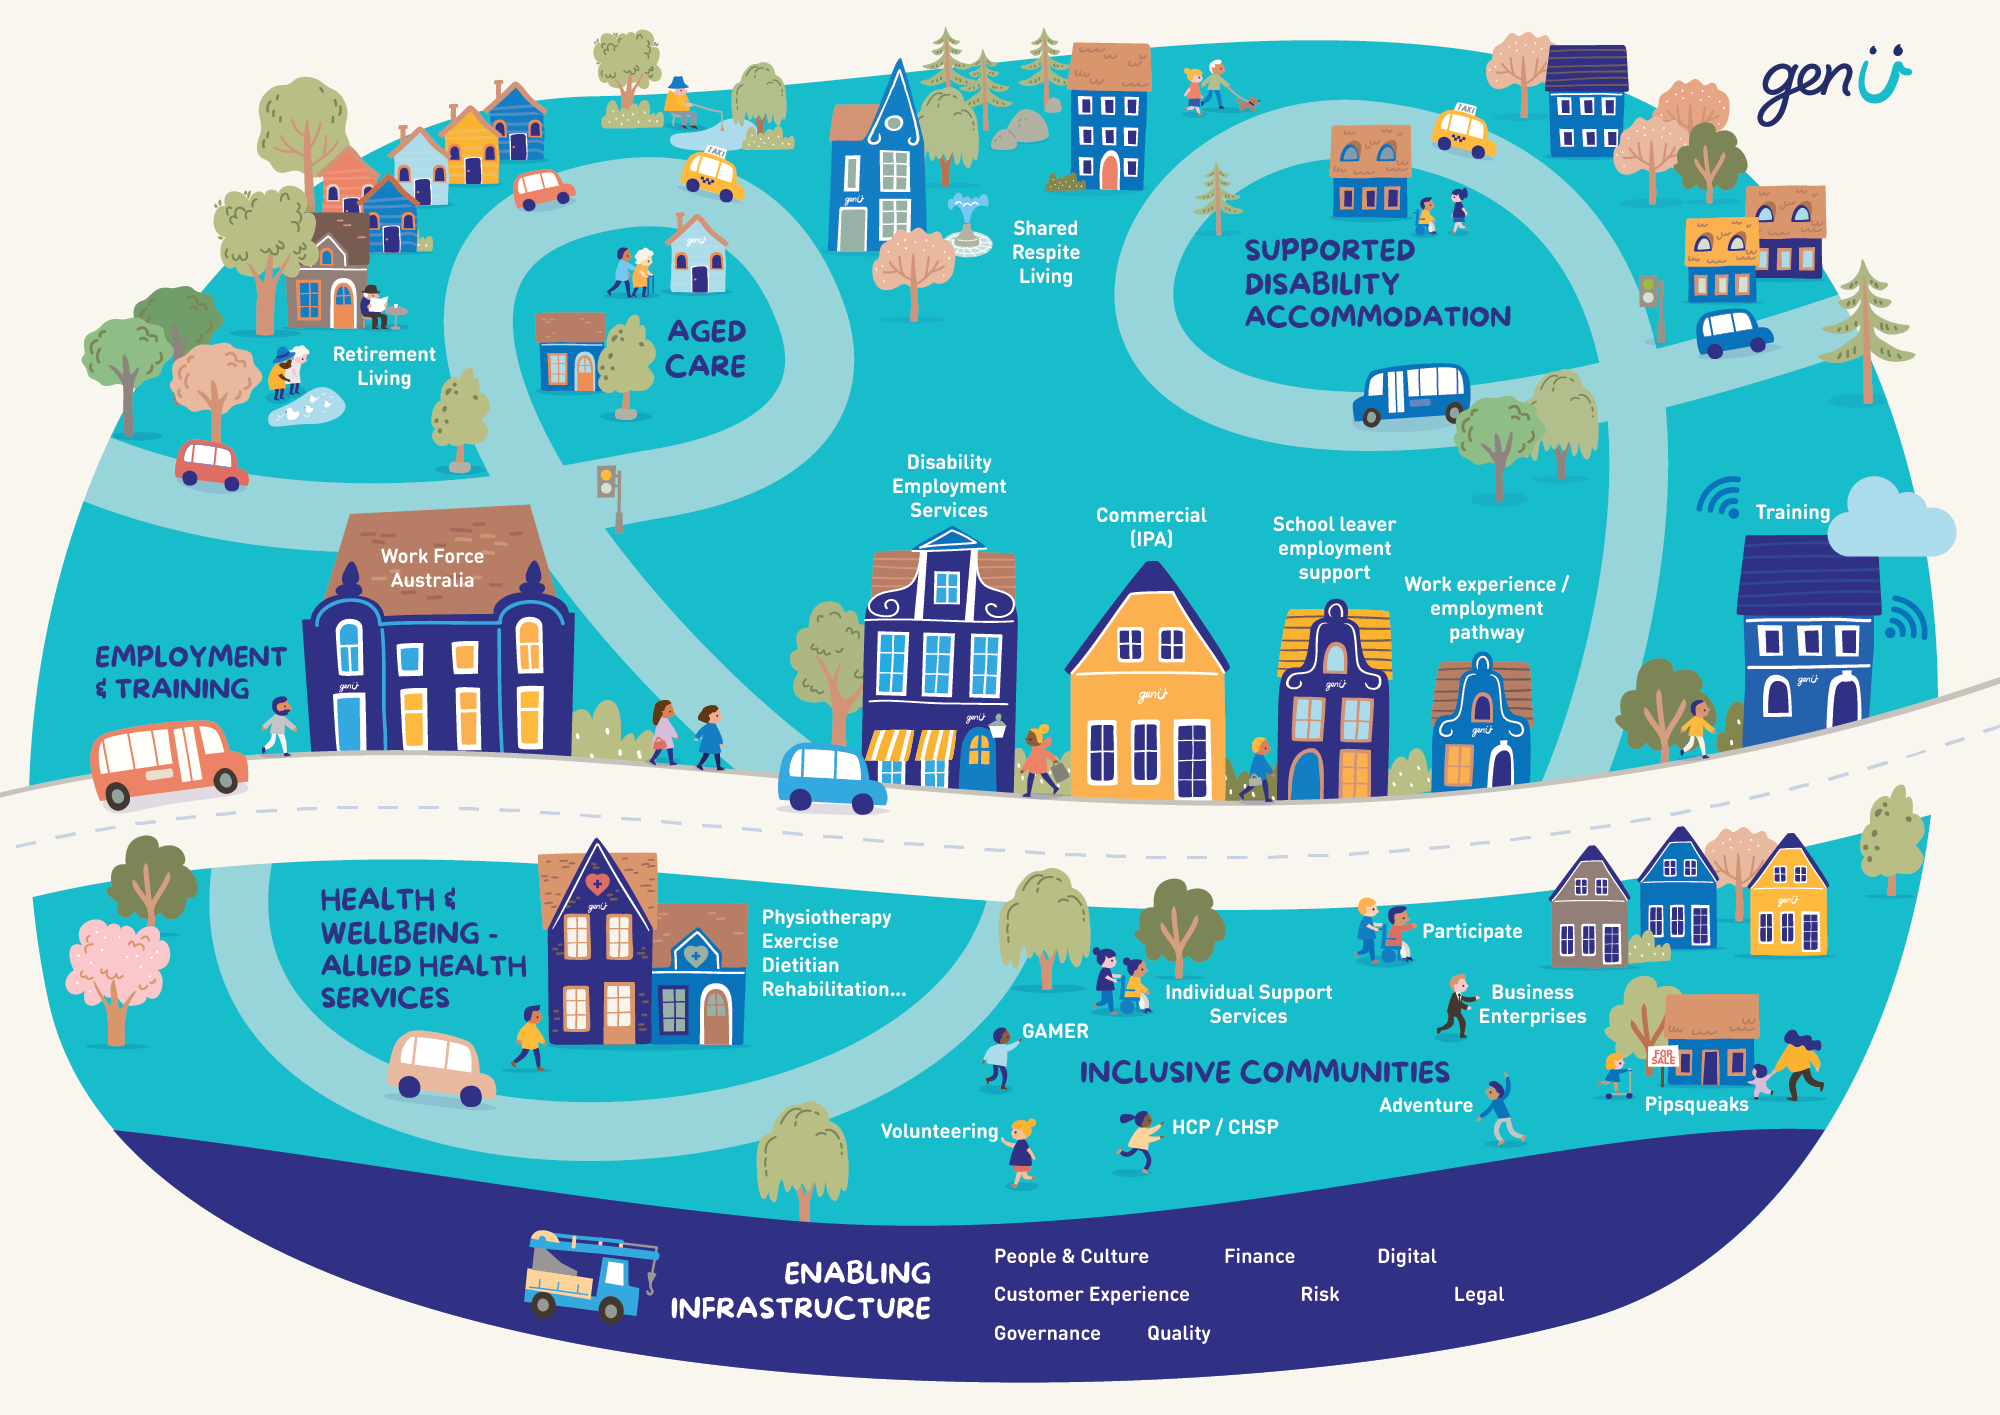
Strategy On a Page (SOAP)
Operational models
Journey maps
Processes & Frameworks
Explainers